
OCR Specification focus:
‘Separate biological compounds using thin-layer or paper chromatography, or electrophoresis, as appropriate to the investigation.’
Chromatography and electrophoresis are essential separation techniques that allow biologists to isolate and analyse biological molecules by exploiting differences in physical or chemical properties effectively.
Chromatography
Chromatography is a laboratory technique used to separate and identify biological compounds. It works because different molecules have different affinities for a stationary phase and a mobile phase, causing them to move at different rates. In OCR Biology, paper chromatography and thin-layer chromatography (TLC) are commonly applied to amino acids, plant pigments, or other mixtures.
Stationary phase: The solid or immobilised medium over which the mobile phase moves.
Solutes that form stronger bonds with the stationary phase travel more slowly, whereas those that dissolve more easily in the solvent travel faster. This produces a chromatogram, a visual separation of components into distinct spots or bands.
Phases, polarity and molecular interactions
The behaviour of molecules in chromatography depends on polarity, molecular size and hydrogen bonding. The mobile phase is typically an organic solvent, while the stationary phase may be cellulose (paper) or a thin coating of silica on a TLC plate. More polar molecules are usually retained longer on a polar stationary phase.
Paper chromatography
Paper chromatography uses absorptive paper containing cellulose fibres. It is often used in schools and field settings because it is simple and low-hazard. A small, concentrated spot of the sample is placed above the solvent line; as the solvent rises, it carries components different distances.
Thin-layer chromatography (TLC)
TLC produces clearer, sharper results. The stationary phase is a thin layer of silica or alumina spread over a rigid plastic or glass plate. TLC is advantageous because:
It separates small quantities effectively
It runs faster than paper chromatography
It provides clearer resolution and greater sensitivity
Retention factor (Rf) and data interpretation
Once the chromatogram has developed, the retention factor (Rf) helps identify molecules by comparing experimental and reference values.
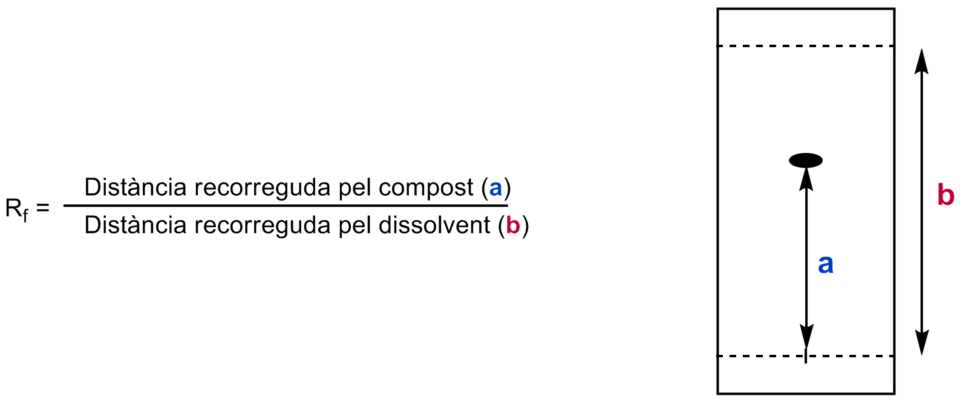
Diagram showing how Rf is measured from the origin to the centre of the spot, compared with the solvent front to calculate the retention factor. Source.
EQUATION
—-----------------------------------------------------------------
Retention factor (Rf) = Distance travelled by solute / Distance travelled by solvent front
Distance travelled by solute = From origin to centre of sample spot (mm)
Distance travelled by solvent front = From origin to solvent front (mm)
—-----------------------------------------------------------------
A visible locating agent or ultraviolet light is often used to reveal colourless compounds, such as amino acids. An Rf value close to published data strengthens identification, though experimental conditions must always match when comparing.
Good practice in chromatography
To obtain reliable results:
Draw the origin line in pencil, not ink
Ensure the solvent front never reaches the top of the plate
Keep samples as concentrated, tiny spots for sharper separation
Use a sealed chamber to maintain solvent saturation and prevent evaporation
Electrophoresis
Electrophoresis is a separation technique that uses an electric field to move charged biological molecules through a medium, usually a gel. Molecules separate according to charge and size, so electrophoresis is ideal for DNA, RNA and proteins.
Electrophoresis: A technique that separates charged molecules by applying an electric current across a gel.
DNA and RNA fragments are negatively charged due to their phosphate groups. When an electric current is applied, fragments migrate toward the positive electrode, with smaller fragments travelling faster and further through the gel matrix.
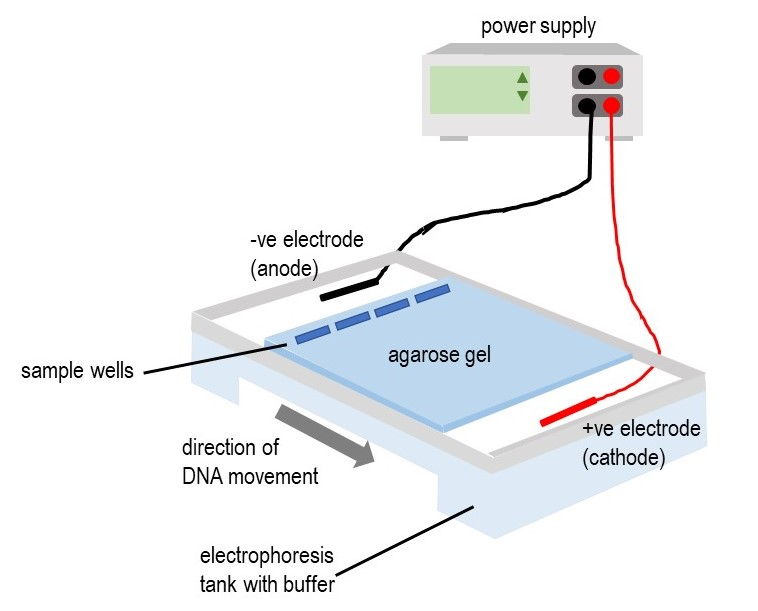
Diagram of agarose gel electrophoresis showing DNA loaded into wells at the negative electrode and migrating toward the positive electrode, forming bands of different sizes. Source.
Gel electrophoresis of nucleic acids
Agarose gel is commonly used as the medium. Samples are loaded into wells at the negative end of the gel tray, and a buffer solution conducts the current. After separation, fragments appear as bands that can be visualised using stains or UV illumination. Banding patterns allow:
Comparison of DNA samples in genetic analysis
Observation of restriction enzyme fragment sizes
Verification of DNA extraction or PCR success
Protein electrophoresis
Proteins vary in charge and shape, so polyacrylamide gels are often used for higher resolution. Sometimes samples are treated with detergents such as SDS to give them a uniform negative charge, ensuring separation is based mainly on size.
Factors influencing electrophoresis
Separation quality is affected by:
Voltage (higher voltage increases speed but risks band distortion)
Gel concentration (denser gels slow larger molecules)
Buffer composition and pH, controlling charge and stability
Sample volume and loading technique
Safe practice and equipment use
Electrophoresis requires correct handling of electrical equipment, staining agents and UV light. Students must:
Keep apparatus dry and intact before switching on
Avoid direct UV exposure
Dispose of stains safely where required
Choosing between chromatography and electrophoresis
Chromatography suits non-charged, soluble mixtures such as pigments or amino acids, while electrophoresis is essential for charged biological molecules. Both methods are key for producing qualitative or semi-quantitative data in biological investigations and align directly with the OCR requirement to separate biological compounds using chromatography or electrophoresis.
Practice Questions
Question 1 (2 marks)
Explain how chromatography can be used to separate different biological molecules in a mixture.
Question 1 (2 marks)
Award up to two marks for:
• Separation occurs because different molecules have different affinities for the stationary phase and mobile phase (1)
• Molecules travel at different speeds or distances, forming separate spots or bands on the chromatogram (1)
Question 2 (5 marks)
Describe how gel electrophoresis separates fragments of DNA and explain how the results can be interpreted to compare genetic samples.
Question 2 (5 marks)
Award up to five marks for:
• DNA fragments are negatively charged and move towards the positive electrode when an electric current is applied (1)
• Smaller fragments travel further or faster through the gel because they experience less resistance (1)
• Bands form at different positions according to fragment size (1)
• A DNA ladder or marker is used to estimate fragment size (1)
• The banding pattern can be compared between samples to identify similarity or difference, such as in genetic analysis (1)
FAQ
The solvent must dissolve the sample but not the stationary phase. It should also produce clear separation between components. In chromatography, polarity is key, as the solvent must promote differential movement of molecules.
A suitable solvent is often identified trial-and-error using small test runs. Sometimes mixed solvents are used to fine-tune separation, especially for amino acids or plant pigments. A good solvent system produces well-defined, non-overlapping spots.
Ink is soluble in many solvents and would dissolve, run, and interfere with the chromatogram. This can cause extra spots that obscure results or mix with the sample.
Pencil contains insoluble graphite, which will not move with the mobile phase, ensuring a clear, stable baseline for accurate Rf measurements.
Poor separation may result from:
• Overloaded sample spots
• A solvent that is too polar or not polar enough
• An unsaturated chromatography chamber
• Impurities or contamination in the sample or solvent
Good practice includes tiny, concentrated spots, fresh solvents, and sealing the chamber to achieve solvent saturation before running the chromatogram.
The buffer maintains a stable pH and conducts the electric current through the gel. Without it, DNA or protein migration would be slow, uneven, or might not occur at all.
Different buffers (such as TAE or TBE for DNA) affect run speed, band sharpness, and heat production. Selecting the appropriate buffer ensures consistent separation and prevents gel damage during the run.
Proteins vary in charge and shape, so they require modified conditions. A common approach is SDS-PAGE, where a detergent (SDS) gives proteins a uniform negative charge.
This allows separation mainly by size, not shape or charge. A stacking gel may also be used to produce sharper bands, improving comparison between protein samples.
