
OCR Specification focus:
‘Use appropriate apparatus to record quantitative measurements and suitable instruments such as colorimeters or potometers.’
Quantitative measurements are central to practical biology, allowing students to generate reliable numerical data using precise instruments to investigate biological patterns, processes, and relationships.
Quantitative measurements in biology
Quantitative measurements are numerical observations collected using calibrated equipment to ensure reliability and accuracy. They are essential for experiments involving rate, concentration, volume, and change over time. Accurate data supports valid conclusions and increases confidence in experimental findings. Quantitative measurements differ from qualitative observations, which are descriptive and lack numerical precision.
Accuracy, precision, and reliability
When using instrumentation, students must distinguish between key measurement concepts to evaluate data quality.
Accuracy: How close a measurement is to the true or accepted value.
A measurement can be made more accurate by using instruments with smaller scale intervals and by calibrating equipment before use.
Precision: The level of agreement between repeated measurements, showing consistency.
Precise results reduce random error, which arises from small, uncontrollable fluctuations in equipment or environment.
Reliability: The extent to which data is repeatable and reproducible when an experiment is repeated under the same conditions.
Reliable data is supported by multiple repeats and the calculation of mean values to smooth out random variation.
Recording quantitative measurements
To correctly record measurements, students must:
Use SI units (seconds, metres, grams, etc.) and include units with every reading
Read instruments at eye level to avoid parallax error
Record an appropriate number of significant figures
Use a calibration curve where direct readings are not possible
Data is often processed into derived quantities such as rate, percentage change, or concentration, requiring careful handling of units.
Using colorimeters
A colorimeter measures the absorbance or transmission of light through a solution to determine the concentration of a coloured substance.
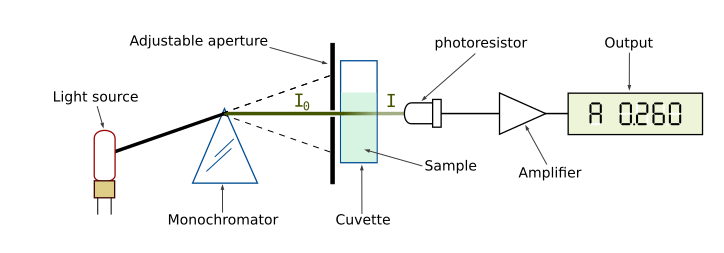
Diagram of a spectrophotometer showing how light passes through a cuvette to a detector. Colorimeters use the same optical principle, although most use fixed filters rather than a monochromator. Source.
Absorbance: A measure of how much light is absorbed by a solution, proportional to the concentration of the solute.
Students must follow a structured process when using a colorimeter:
Switch on and allow warm-up time
Select an appropriate filter for the wavelength absorbed by the sample
Zero or blank the colorimeter using distilled water
Place samples in clean cuvettes, ensuring no fingerprints or bubbles
Measure absorbance at set time intervals
Plot a calibration curve using known concentrations to determine unknowns
Colorimeters reduce subjectivity and increase precision compared with visual comparison of colour intensity.
Using potometers
A potometer measures the rate of water uptake in plants, used as an estimate of transpiration rate.
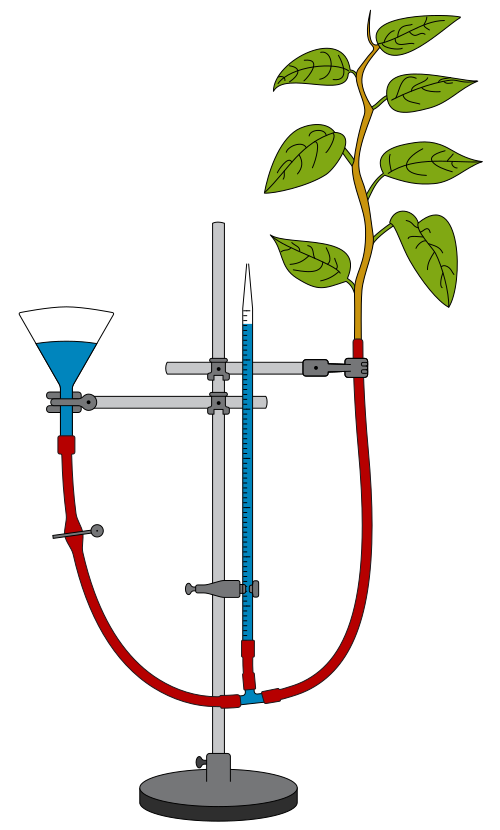
Diagram of a bubble potometer used to measure the rate of water uptake. The movement of the air bubble along the capillary tube is timed to calculate transpiration rate. Source.
Transpiration: The loss of water vapour from plant leaves via stomata, driven by evaporation and diffusion.
To obtain valid readings using a potometer, students must:
Cut the shoot underwater to prevent air embolisms
Assemble the apparatus underwater to avoid trapped air
Ensure all joints are airtight and watertight
Introduce and reset the bubble at the capillary start position
Record movement over a known time interval
Control variables such as light, humidity, temperature, and air movement
The potometer produces quantitative data that can be expressed as rate of uptake, allowing comparison between treatments.
Calibration and zeroing of instruments
Many instruments require calibration to ensure accuracy. For example:
Colorimeters are blanked with distilled water
pH meters are calibrated with buffer solutions
Balances are zeroed before weighing
Regular calibration minimises systematic error, which shifts all readings away from the true value in the same direction.
Good practice in quantitative work
Students must use instrumentation safely, systematically, and critically. Good practice includes:
Repeating readings to calculate a mean
Identifying anomalies and considering whether to exclude them
Using appropriate graph scales and software for data presentation
Selecting instruments with a suitable level of sensitivity and resolution
Quantitative measurements and instrumentation allow biological investigations to be repeatable, valid, and scientifically meaningful, aligning closely with OCR practical expectations.
Practice Questions
Question 1 (2 marks)
A student uses a colorimeter to measure the absorbance of a solution. State one reason why the colorimeter is blanked before readings are taken and identify what should be used to blank it.
Question 1 (2 marks)
Blanking ensures the colorimeter is zeroed and that absorbance readings are due only to the sample, not the solvent or cuvette (1 mark)
Distilled water should be used as the blank (1 mark)
Question 2 (5 marks)
A potometer is used to investigate the rate of transpiration in a leafy shoot. Describe how the student should set up and use the potometer to obtain valid quantitative results, and explain how the data collected can be used to compare transpiration rates between treatments.
Question 2 (5 marks)
Award 1 mark for each valid point, up to 5 marks:
Cut the shoot underwater and assemble the potometer underwater to prevent air bubbles entering the xylem or apparatus (1 mark)
Ensure all joints are airtight and watertight to prevent leaks that would affect measurements (1 mark)
Introduce and monitor the movement of an air bubble or meniscus over a set time interval to collect quantitative data on water uptake (1 mark)
Control key variables such as temperature, humidity, light intensity and air movement so that only the experimental treatment is changing (1 mark)
Calculate and compare rates of transpiration between treatments using distance moved by the bubble per unit time (e.g., mm per minute or similar acceptable unit) (1 mark)
FAQ
First, a series of known concentrations is measured using the colorimeter and their absorbance values are plotted on a graph. A line of best fit is then drawn.
The absorbance of the unknown sample is read on the same graph, and its concentration is determined by tracing across to the line, then down to the x-axis. Only values within the original calibration range should be used to avoid extrapolation errors.
Unreliable readings can be caused by fingerprints on cuvettes, bubbles in the sample, using scratched glassware, or inconsistent cuvette orientation.
To minimise error:
Wipe cuvettes before use
Ensure samples are degassed or bubble-free
Use matched cuvettes and insert them the same way each time
Repeat and average readings to smooth random error
A potometer tracks the movement of water through the stem, not the actual mass of water lost as vapour. Although closely linked, some water is used for cell processes or stored temporarily.
Because the majority of water taken up by roots is lost via transpiration, uptake becomes a reliable proxy. This provides a practical and quantitative alternative to direct measurement.
Key external factors include:
Light intensity (stimulates stomatal opening)
Wind or air movement (maintains steep diffusion gradient)
Temperature (increases evaporation rate)
Humidity (affects water vapour gradient)
Controlling these ensures that differences in water uptake are due to the independent variable rather than uncontrolled external changes.
Instrument resolution determines the smallest measurable change. A low-resolution instrument may mask subtle differences in results, reducing sensitivity.
Choosing a tool with an appropriate resolution increases confidence in identifying trends and improves the precision of calculated rates.
