
OCR Specification focus:
‘Outline SAN, AVN and Purkyne tissue roles in myogenic control; interpret ECG traces, recognising tachycardia, bradycardia, fibrillation and ectopic beats.’
The heart’s rhythmic contraction is coordinated by specialised tissues that generate and conduct electrical impulses, ensuring blood flows efficiently through the circulatory system and that cardiac events remain synchronised.
Myogenic Control of the Heart
The mammalian heart is myogenic, meaning it can initiate its own contractions without nervous stimulation. Electrical activity begins within the heart muscle itself, allowing the cardiac cycle to proceed autonomously yet remain modulated by the nervous system and hormones.
The Sinoatrial Node (SAN)
The sinoatrial node (SAN), located in the wall of the right atrium, acts as the natural pacemaker of the heart.
It generates regular electrical impulses that spread across the atria, causing atrial systole (contraction of the atrial walls).
Sinoatrial Node (SAN): A small region of specialised cardiac muscle cells that initiates the heartbeat by generating electrical impulses at regular intervals.
The impulses from the SAN travel rapidly through the atrial myocardium, stimulating both atria to contract almost simultaneously, pushing blood into the ventricles. The non-conductive tissue between the atria and ventricles prevents these impulses from passing directly to the ventricles, ensuring the atria empty before ventricular contraction begins.
The Atrioventricular Node (AVN)
The atrioventricular node (AVN), found at the junction between the atria and ventricles, receives the SAN’s electrical signal. It introduces a short delay (~0.1 seconds) before transmitting the impulse to the ventricles.
This delay allows:
The atria to complete contraction and empty blood into the ventricles.
The ventricles to fill fully before contraction begins.
Atrioventricular Node (AVN): A cluster of cells that transmits the electrical impulse from the atria to the ventricles with a short delay to coordinate the cardiac cycle.
After the delay, the AVN passes the impulse down a specialised bundle of conductive fibres known as the Bundle of His.
The Bundle of His and Purkyne Fibres
The Bundle of His is located in the interventricular septum and divides into right and left branches. These branches transmit the electrical impulse to the Purkyne fibres (or Purkinje fibres) located within the ventricle walls.
Purkyne Tissue (Purkinje Fibres): Specialised conducting fibres that rapidly distribute the electrical impulse through the ventricular walls, causing coordinated contraction from the apex upwards.
The Purkyne fibres ensure that ventricular contraction (ventricular systole) begins at the apex of the heart and travels upward. This coordinated contraction pushes blood efficiently out of the heart — into the aorta from the left ventricle and the pulmonary artery from the right ventricle.
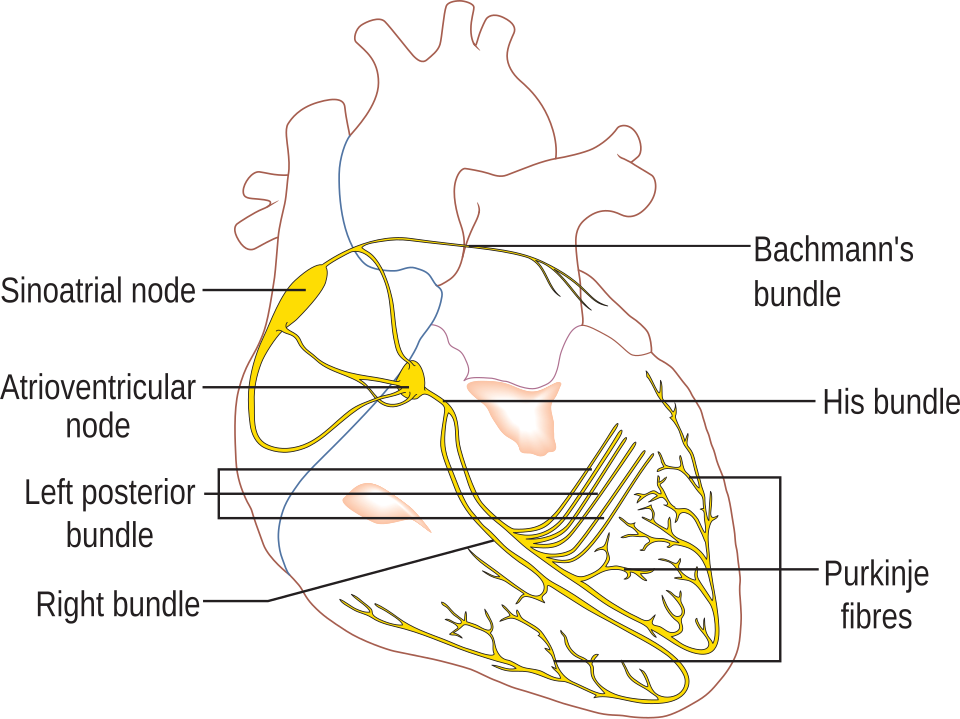
Labeled diagram of the cardiac conduction system showing the sinoatrial node (SAN), atrioventricular node (AVN), Bundle of His, bundle branches and Purkyne fibres. The layout clarifies how excitation descends through the septum and then spreads upward from the apex to coordinate ventricular systole. This image includes bundle-branch detail consistent with syllabus depth. Source.
Sequence of Electrical Conduction
The pathway of excitation through the heart is as follows:
SAN generates the impulse → atria contract.
AVN delays transmission → ensures atria empty.
Bundle of His conducts the impulse down the septum.
Purkyne fibres spread the impulse through ventricles → ventricles contract from the apex upwards.
This sequence ensures a coordinated cardiac cycle, maintaining effective pumping and unidirectional blood flow.
Role of the Nervous System
Although the heart is myogenic, its rate and strength of contraction can be adjusted by the autonomic nervous system:
Sympathetic stimulation (via noradrenaline) increases SAN firing rate → heart rate increases.
Parasympathetic stimulation (via acetylcholine) decreases SAN firing rate → heart rate decreases.
This modulation allows the body to adapt to varying demands such as exercise or rest.
Electrocardiograms (ECGs)
An electrocardiogram (ECG) is a trace of the electrical activity of the heart recorded over time. It detects the voltage changes produced during depolarisation and repolarisation of the cardiac muscle.
Electrocardiogram (ECG): A graphical representation of the heart’s electrical activity used to assess rhythm, rate, and conduction abnormalities.
Components of a Normal ECG Trace
Each wave on an ECG corresponds to a specific electrical event within the cardiac cycle:
P wave – depolarisation of the atria (atrial systole).
QRS complex – depolarisation of the ventricles (ventricular systole).
T wave – repolarisation of the ventricles (ventricular diastole).
The intervals and amplitudes between these waves provide vital information about heart function and rhythm.
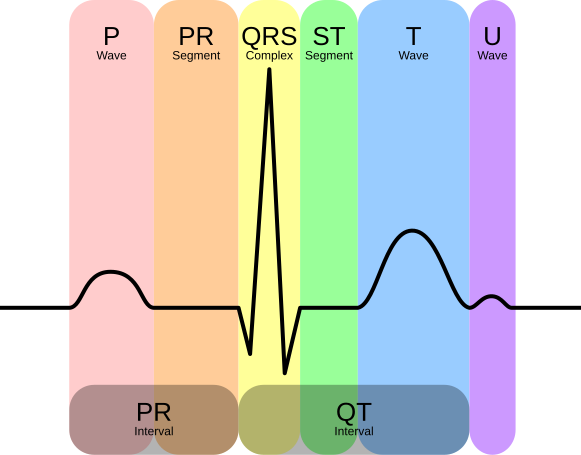
Schematic of a normal ECG annotated with P wave, QRS complex, ST segment, and T wave. This clarifies how each deflection corresponds to atrial depolarisation, ventricular depolarisation, and ventricular repolarisation. Labels include standard interval markers appropriate for A-Level depth. Source.
Interpreting ECG Traces
Changes in heart rhythm are reflected as abnormalities in ECG patterns. Recognising these is essential for identifying different cardiac conditions:
Tachycardia – A fast heart rate, typically above 100 beats per minute (bpm). The ECG shows shortened intervals between successive QRS complexes.
Bradycardia – A slow heart rate, below 60 bpm. The intervals between QRS complexes are prolonged.
Fibrillation – Uncoordinated, irregular contractions due to chaotic electrical activity. The ECG shows erratic, irregular waveforms without clear P, QRS, or T waves.
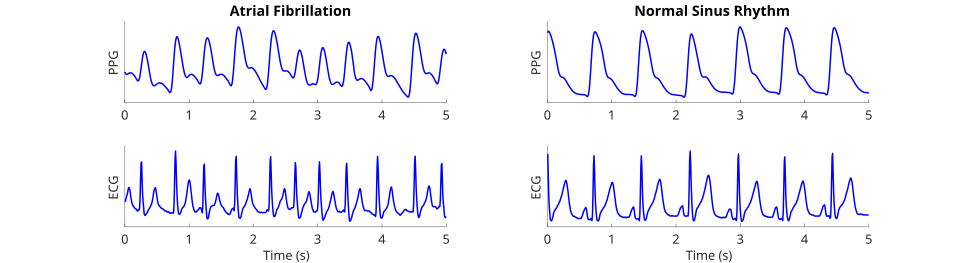
Comparison of atrial fibrillation and normal sinus rhythm using ECG strips; AF shows an irregularly irregular rhythm without consistent P waves. The graphic also includes a photoplethysmogram (PPG) trace above the ECG, which is extra detail beyond the OCR syllabus but does not distract from the ECG features. Use primarily the ECG portion for teaching recognition. Source.
Ectopic beat – An extra or premature heartbeat, often seen as an additional QRS complex or irregular spacing on the ECG trace.
These patterns are vital indicators used in diagnosing cardiac abnormalities and assessing cardiovascular health.
Importance of ECG Analysis
Clinicians use ECGs to:
Assess heart rhythm and rate.
Detect conduction abnormalities or damage to heart tissue.
Monitor the effects of drugs or electrolyte imbalances.
Identify life-threatening arrhythmias promptly.
Coordination and Efficiency
The synchronisation between SAN, AVN, and Purkyne tissue ensures that atrial and ventricular events occur in the correct sequence and timing.
This precise control maintains:
Efficient blood flow through the heart chambers.
Maximal cardiac output for metabolic demands.
Stable rhythm under varying physiological conditions.
Practice Questions
Question 1 (2 marks)
Describe the role of the sinoatrial node (SAN) in controlling the heartbeat.
Mark scheme:
1 mark: The SAN acts as the heart’s natural pacemaker, generating regular electrical impulses.
1 mark: These impulses spread across the atria, causing atrial contraction (atrial systole) and initiating the heartbeat.
Question 2 (5 marks)
Explain how the electrical activity of the heart is coordinated to produce a normal heartbeat, and describe how this can be interpreted using an electrocardiogram (ECG) trace.
Mark scheme:
1 mark: The SAN generates electrical impulses that cause atria to contract.
1 mark: The impulse is delayed at the AVN to allow the atria to empty before the ventricles contract.
1 mark: The impulse travels through the Bundle of His and Purkyne fibres, causing ventricular contraction from the apex upwards.
1 mark: On an ECG, the P wave represents atrial depolarisation, the QRS complex represents ventricular depolarisation, and the T wave represents ventricular repolarisation.
1 mark: A regular pattern of these waves indicates coordinated cardiac activity and a normal sinus rhythm.
FAQ
The firing rate of the SAN is influenced by the autonomic nervous system and hormonal signals.
Sympathetic stimulation (noradrenaline) increases impulse frequency, raising heart rate during stress or exercise.
Parasympathetic stimulation (acetylcholine via the vagus nerve) reduces firing rate, slowing the heart at rest.
Adrenaline released by the adrenal medulla can also increase SAN activity during the “fight or flight” response.
Temperature, blood pH, and oxygen concentration can further modulate SAN firing indirectly through chemoreceptor and thermoreceptor feedback.
The delay ensures the atria have time to fully contract and empty blood into the ventricles before ventricular contraction begins.
This delay occurs because:
AVN cells conduct impulses slowly compared to atrial muscle fibres.
The region has fewer gap junctions, reducing electrical continuity.
The non-conductive fibrous tissue between atria and ventricles ensures impulses must pass through the AVN, controlling timing precisely.
This coordinated delay prevents overlap between atrial and ventricular systole, maximising cardiac efficiency.
Purkyne fibres transmit impulses rapidly through the ventricular walls, beginning at the apex of the heart.
This causes the contraction to move upwards towards the base, ensuring:
Blood is ejected efficiently into the aorta and pulmonary artery.
Ventricular contraction is coordinated and complete.
The apex-to-base contraction prevents blood pooling and supports the unidirectional flow of blood through the valves.
Atrial depolarisation (P wave) involves a smaller muscle mass, generating lower voltage and a shorter-duration signal.
Ventricular depolarisation (QRS complex) involves a much larger muscle mass, producing a higher amplitude and longer-lasting deflection on the ECG.
Additionally, ventricular depolarisation occurs in multiple stages through the Bundle of His and Purkyne fibres, while atrial depolarisation spreads uniformly across the atrial myocardium.
ECG abnormalities reveal specific types of heart dysfunction:
Prolonged PR interval – delayed conduction between SAN and AVN (first-degree heart block).
Wide QRS complex – impaired ventricular conduction (bundle branch block).
Elevated or depressed ST segment – possible myocardial infarction or ischaemia.
Absent P waves – atrial fibrillation, where the atria depolarise irregularly.
Interpreting these patterns helps clinicians locate the origin of electrical disturbances and assess the severity of conduction problems.
