
OCR Specification focus:
‘Chemical reactions involve enthalpy changes. Exothermic processes have negative ΔH; endothermic processes have positive ΔH. Enthalpy profile diagrams compare reactants and products.’
Enthalpy changes underpin how chemical reactions absorb or release energy, and understanding these patterns is essential for interpreting reaction behaviour and graphical energy representations.
Exothermic and Endothermic Processes
Chemical reactions always involve a change in enthalpy, the heat content of a system at constant pressure. When reactants transform into products, bonds are broken and formed, leading to measurable energy changes.
Enthalpy change (ΔH): The heat energy exchanged with the surroundings during a reaction at constant pressure.
Exothermic and endothermic reactions are distinguished by the direction of energy transfer between the system and surroundings. These processes can be interpreted through sign conventions as well as enthalpy profile diagrams.
Exothermic Processes
In exothermic reactions, energy is released into the surroundings, leading to a temperature increase of the reaction mixture. Because the system loses energy, the enthalpy change is negative.
Exothermic process: A reaction in which energy is transferred from the system to the surroundings, giving a negative enthalpy change (ΔH < 0).
A single sentence must follow before any further definition blocks. Exothermic reactions are common in combustion, neutralisation, and many oxidation processes, all characterised by product enthalpy being lower than reactant enthalpy.
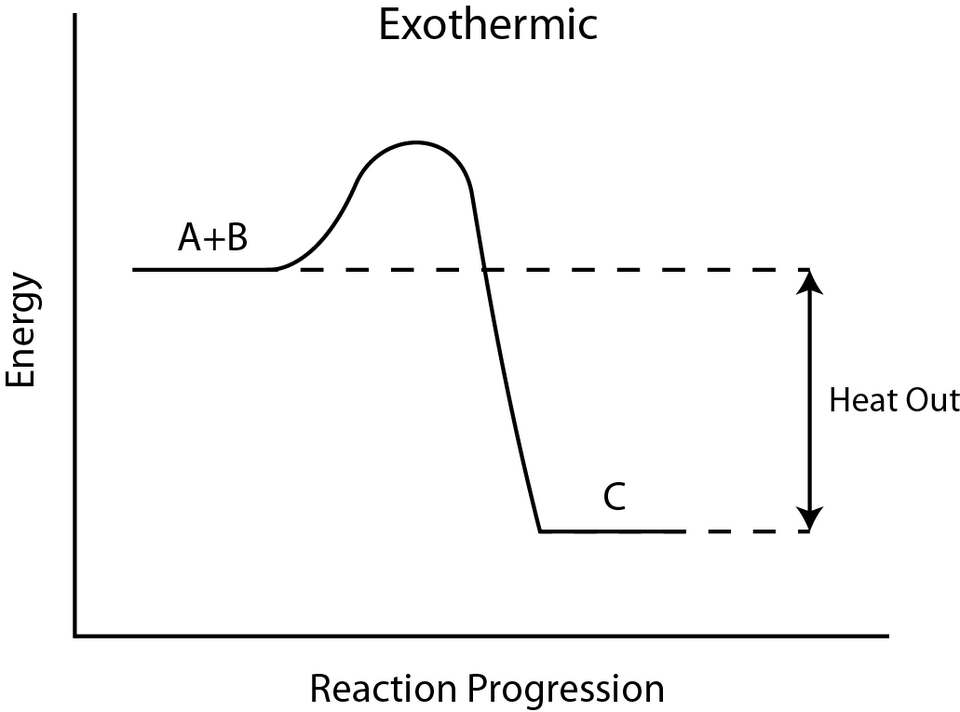
Energy profile diagram for an exothermic reaction, showing reactants at higher energy and products at lower energy with a negative enthalpy change. The curve passes over an activation-energy peak before dropping, linking the diagram to how reactions start. The source also contains additional bond‑energy context not required by the OCR specification. Source
Key features include:
Temperature rise as surroundings gain energy
Negative ΔH because the system has released heat
Products lower in energy than reactants on an enthalpy profile diagram
Bond making often dominating the energy balance
Endothermic Processes
Endothermic reactions absorb energy from the surroundings, causing a drop in temperature. Here, the system gains energy, giving a positive enthalpy change.
Endothermic process: A reaction in which energy is absorbed from the surroundings, giving a positive enthalpy change (ΔH > 0).
After this explanation, it becomes clear that endothermic reactions often involve significant energy input to break bonds or rearrange structures. Examples include thermal decomposition and some reduction processes.
Key features include:
Temperature decrease as the system absorbs energy
Positive ΔH because heat enters the system
Products higher in energy than reactants
Bond breaking requiring substantial input energy
Enthalpy Profile Diagrams
Enthalpy profile diagrams visually compare the energies of reactants and products, showing the enthalpy change and, where appropriate, activation energy. For this subsubtopic, the emphasis is on the comparison of initial and final energy levels, aligning with the specification requirement.
Enthalpy profile diagram: A graphical representation showing the enthalpy of reactants and products during a chemical reaction.
Students should use these diagrams to interpret whether a reaction is exothermic or endothermic and to relate visual gradients to the sign of ΔH. A diagram’s vertical axis always represents enthalpy, enabling straightforward comparison.
Important elements include:
Reactant energy level
Product energy level
Direction and magnitude of ΔH
Overall shape indicating energy release or absorption
Exothermic Enthalpy Profiles
Exothermic diagrams display a downward energy change, showing products at a lower enthalpy than reactants.
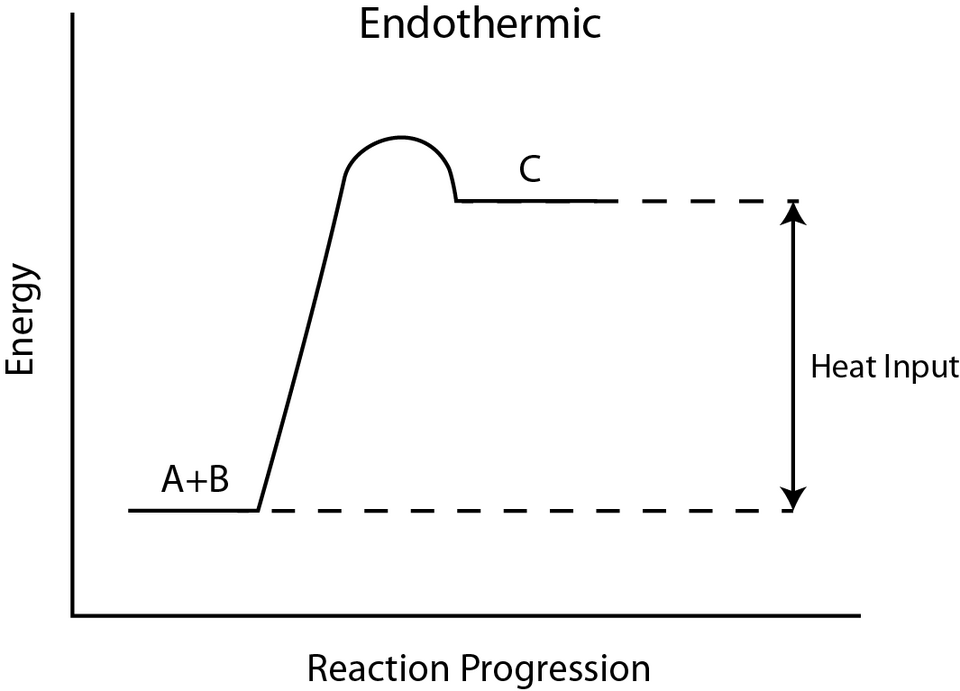
Energy profile diagram for an endothermic reaction showing the rise from lower‑energy reactants to higher‑energy products, illustrating a positive enthalpy change. The diagram also shows the activation energy required to initiate the reaction. Some accompanying bond‑energy discussion on the source page exceeds OCR requirements. Source
Features:
Negative ΔH indicated by a downward arrow
Energy released as products form
Lower product enthalpy, demonstrating greater stability
These diagrams reflect that bond formation releases more energy than is required to break bonds in the reactants.
Endothermic Enthalpy Profiles
Endothermic diagrams show an upward energy change, representing products at higher enthalpy.
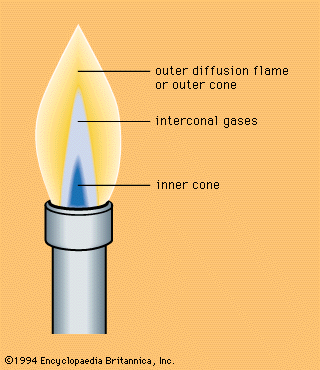
Bunsen burner flame illustrating an exothermic combustion reaction where heat is released to the surroundings. The visible flame corresponds to the energy drop seen in exothermic enthalpy profiles. The page also includes additional flame‑type information not required for this OCR subsubtopic. Source
Features:
Positive ΔH indicated by an upward arrow
Energy absorbed from the surroundings
Higher product enthalpy, meaning less stable products
Such profiles reinforce the concept that additional energy must be supplied for the reaction to proceed.
Energy Transfer and Reaction Behaviour
Understanding energy flow helps explain observable reaction characteristics, especially temperature changes and stability trends.
Key considerations include:
Energy conservation: Total energy remains constant; only distribution changes
Stability of products vs. reactants: Lower enthalpy corresponds to greater thermodynamic stability
Extent of temperature change: Related to energy transfer per mole
These ideas support interpretation of reaction thermodynamics and align with the OCR expectation for precise use of chemical language.
Practical Contexts in Enthalpy Studies
Although this subsubtopic does not cover calorimetry or quantitative measurement, recognising the qualitative behaviour of exothermic and endothermic reactions is essential before approaching experimental techniques later in the specification.
Important real-world contexts include:
Industrial exothermic reactions where heat management is crucial
Endothermic processes requiring continuous energy input
Safety considerations due to temperature shifts during reactions
Predicting reaction feasibility based on enthalpic factors
These applications anchor the theoretical principles and prepare students for more advanced topics within physical chemistry.
Practice Questions
State what is meant by an exothermic reaction and explain the sign of its enthalpy change.
(2 marks)
1 mark: States that an exothermic reaction releases energy to the surroundings.
1 mark: Explains that the enthalpy change is negative because the system loses energy.
The diagram below represents an enthalpy profile for a chemical reaction.
Reactants → (energy rises to a peak) → Products
(a) Identify whether the reaction is exothermic or endothermic. (1 mark)
(b) Explain how the enthalpy change shown in the diagram supports your answer in part (a). (2 marks)
(c) Describe how the temperature of the surroundings would change during this reaction and explain why. (2 marks)
(5 marks)
(a)
1 mark: Correctly identifies the reaction as exothermic or endothermic (depending on the drawn diagram:
If products are lower in energy → exothermic
If products are higher in energy → endothermic).
(b)
1 mark: Refers to the relative enthalpy levels of reactants and products.
1 mark: Links this to the sign of the enthalpy change (negative if exothermic, positive if endothermic).
(c)
1 mark: Correctly states how the temperature of the surroundings changes (increases for exothermic; decreases for endothermic).
1 mark: Explains that energy is released to, or absorbed from, the surroundings, causing the temperature change.
FAQ
The relative enthalpy levels determine the thermodynamic stability of substances. Products formed at lower enthalpy in exothermic reactions are generally more stable because they possess less stored chemical energy.
In endothermic reactions, products lie at a higher enthalpy level and are therefore less stable unless additional factors, such as entropy or external conditions, favour their formation.
Certain reactions involve equilibria in which temperature strongly influences the direction of energy flow. If heating shifts the reaction to absorb energy, it appears endothermic; if cooling shifts it to release energy, it appears exothermic.
This behaviour is often observed when bond strengths change or when different reaction pathways become available at varying temperatures.
Activation energy illustrates the minimum energy needed for particles to react, but enthalpy profiles only describe energy changes between reactants and products.
Kinetic details such as rate, collision frequency, or molecular orientation are not shown because profile diagrams depict energy levels, not molecular behaviour during collisions.
Bond breaking always requires energy, while bond formation always releases energy.
A reaction becomes:
Exothermic when the energy released from forming new bonds exceeds the energy required to break existing bonds.
Endothermic when breaking bonds requires more energy than is released during bond formation.
Temperature change depends on factors beyond ΔH, including:
The mass of the reacting system
The specific heat capacity of the mixture
The extent of the reaction
Two reactions with the same enthalpy change may produce different temperature shifts if these variables differ, meaning ΔH alone does not determine observed heating or cooling.
