
OCR Specification focus:
‘Explain buffer action and formation; calculate buffer pH; describe blood H₂CO₃/HCO₃⁻ control; interpret titration curves and indicator choice; use a pH meter.’
Buffers maintain stable pH in chemical and biological systems. This topic explains buffer action, blood pH control, titration curve interpretation, indicator selection, and accurate pH measurement.
Buffers and Buffer Action
A buffer solution resists changes in pH when small amounts of acid or alkali are added. Buffers are essential in chemical reactions and biological systems where pH stability is critical.
Buffer solution: A solution that minimises pH changes when small amounts of acid or base are added.
Buffers are formed from:
A weak acid and its conjugate base (e.g. ethanoic acid and sodium ethanoate).
A weak base and its conjugate acid (e.g. ammonia and ammonium chloride).
Buffer action depends on reversible reactions that remove added H⁺ or OH⁻ ions:
Added H⁺ ions are removed by reaction with the conjugate base.
Added OH⁻ ions are removed by reaction with the weak acid.
For an acidic buffer:
CH₃COO⁻ + H⁺ → CH₃COOH
CH₃COOH + OH⁻ → CH₃COO⁻ + H₂O
The equilibrium shifts to oppose changes in ion concentration, following Le Chatelier’s principle.
Calculating Buffer pH
The pH of a buffer depends on the Ka of the weak acid and the ratio of conjugate base to acid concentrations.
pKa: The negative logarithm of the acid dissociation constant, Ka, indicating the strength of a weak acid.
For buffer calculations, concentrations are assumed to remain approximately constant due to limited dissociation. This allows buffer pH to be calculated without solving quadratic equations.
The pH is influenced by:
The relative concentrations of acid and conjugate base.
The value of Ka or pKa.
Dilution, which does not significantly change pH if the ratio remains constant.
Buffers are most effective when:
pH ≈ pKa
Acid and conjugate base concentrations are similar.
Blood pH and the Carbonic Acid–Hydrogencarbonate System
Human blood pH is tightly controlled at approximately 7.35–7.45, essential for enzyme activity and metabolism.
The main blood buffer system is the carbonic acid–hydrogencarbonate buffer, involving:
Carbonic acid (H₂CO₃)
Hydrogencarbonate ions (HCO₃⁻)
This buffer is an open system, linked to respiration and gas exchange in the lungs.
Key equilibria involved:
CO₂ + H₂O ⇌ H₂CO₃
H₂CO₃ ⇌ H⁺ + HCO₃⁻
Buffer control mechanisms:
Increased CO₂ shifts equilibrium to produce more H⁺, lowering pH.
Increased breathing removes CO₂, shifting equilibrium to reduce H⁺ concentration.
Kidneys regulate HCO₃⁻ concentration in blood plasma.
This system allows rapid and continuous regulation of blood pH under varying metabolic conditions.
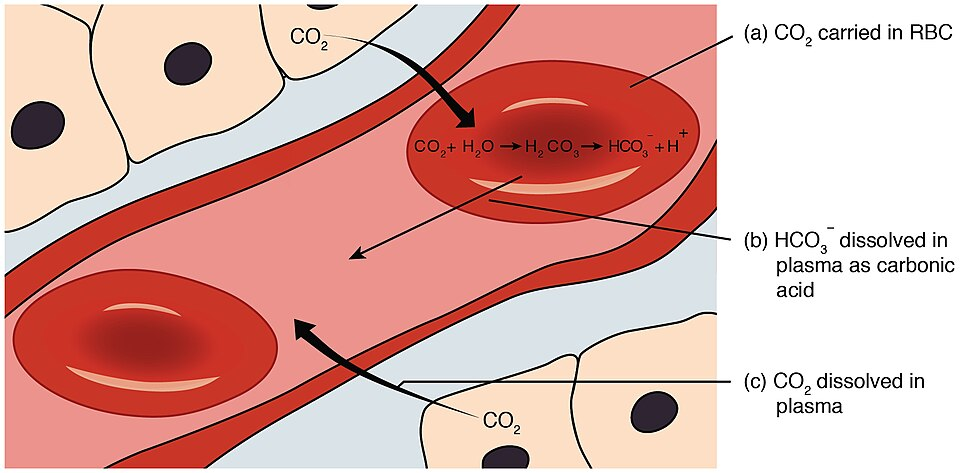
This diagram shows how carbon dioxide is converted to carbonic acid and hydrogencarbonate ions in blood, linking respiration to blood pH control. It illustrates the reversible equilibria that allow rapid regulation of hydrogen ion concentration. Extra transport details are included beyond OCR requirements. Source
Titration Curves
A titration curve shows how pH changes as one solution is added gradually to another.
Titration curve: A graph of pH against volume of titrant added during a titration.
Different titrations produce characteristic curves:
Strong acid–strong base: Sharp vertical region around pH 7.
Weak acid–strong base: Buffer region followed by equivalence point above pH 7.
Weak base–strong acid: Buffer region with equivalence point below pH 7.
Key features to interpret:
Initial pH reflects acid or base strength.
Buffer region shows gradual pH change due to buffer formation.
Equivalence point indicates stoichiometric neutralisation.
Half-equivalence point occurs where pH = pKa for weak acids.
Understanding these features helps predict pH changes and select appropriate indicators.
Indicators and Indicator Choice
Indicators are weak acids or bases that change colour over a narrow pH range.
Indicator: A substance that changes colour over a specific pH range, used to detect the end point of a titration.
Indicator choice depends on matching the indicator’s pH transition range to the steep part of the titration curve near the equivalence point.
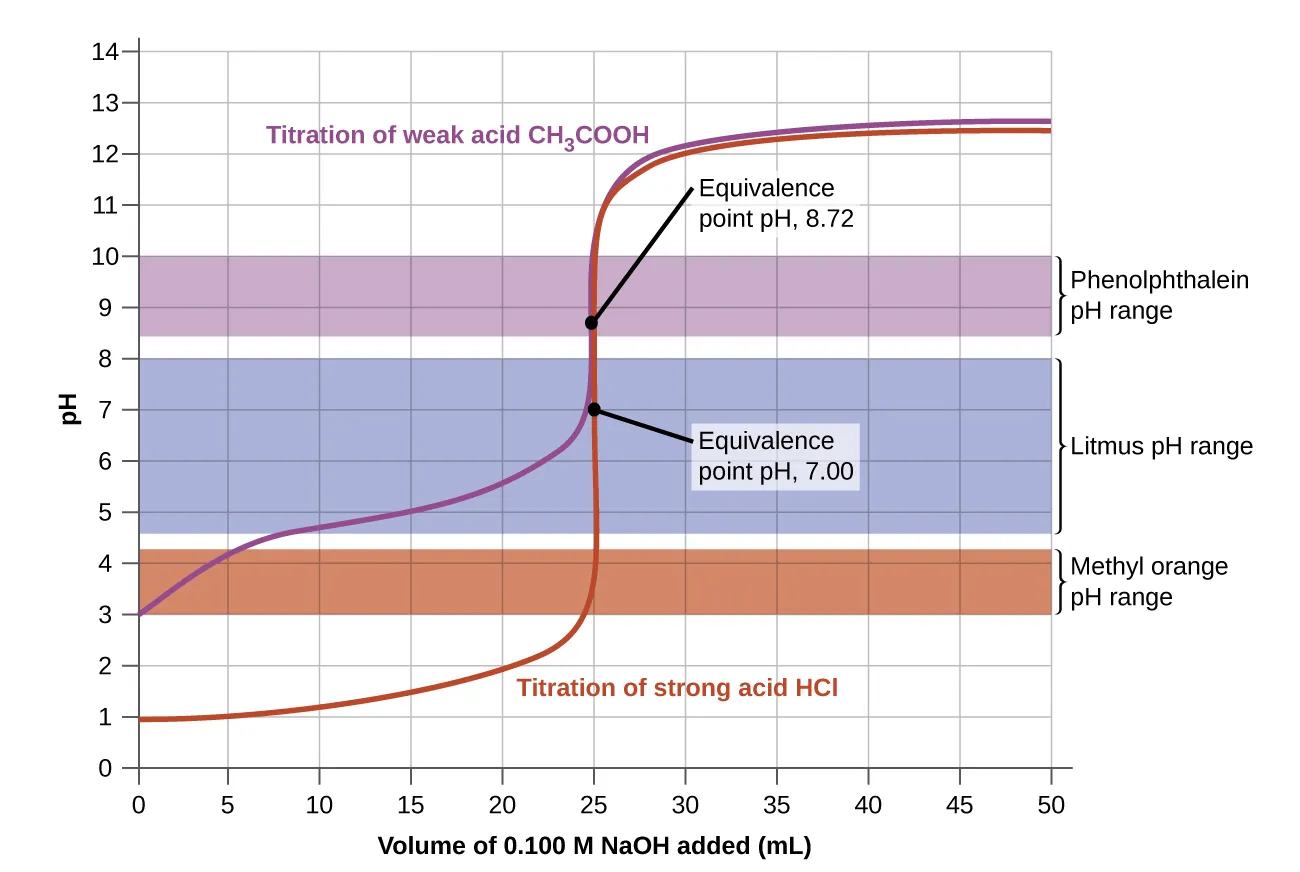
This titration curve shows pH change during the titration of a weak acid with a strong base, highlighting the equivalence point. The coloured bands show indicator transition ranges, demonstrating why correct indicator choice is essential for accurate end-point detection. Source
Guidelines for selection:
Strong acid–strong base: Any indicator with a transition near pH 7.
Weak acid–strong base: Indicator with transition above pH 7 (e.g. phenolphthalein).
Weak base–strong acid: Indicator with transition below pH 7 (e.g. methyl orange).
Indicators are unsuitable for some titrations with very shallow pH changes near equivalence.
pH Meters
A pH meter provides accurate and continuous measurement of pH, independent of colour changes.
pH meter: An electronic device that measures pH using a glass electrode sensitive to hydrogen ion concentration.
Key features of pH meters:
Measure electrical potential related to [H⁺].
Provide greater precision than indicators.
Suitable for coloured or opaque solutions.
Correct use involves:
Calibration with standard buffer solutions.
Rinsing the electrode between measurements.
Allowing readings to stabilise before recording.
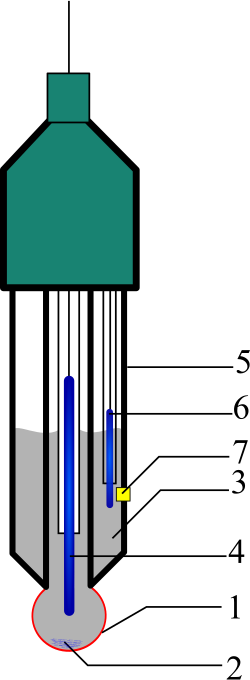
This schematic shows the structure of a glass pH electrode, including the sensing bulb and reference junction. It illustrates how differences in hydrogen ion concentration generate an electrical potential used to determine pH. Source
pH meters are essential for accurate titration curves, buffer analysis, and biological applications where small pH changes are significant.
Practice Questions
Explain how a buffer solution minimises the change in pH when a small amount of hydrochloric acid is added.
(2 marks)
States that the conjugate base reacts with added H⁺ ions. (1 mark)
Explains that this removes H⁺ ions, preventing a large change in pH / equilibrium shifts to oppose the change. (1 mark)
A student investigates the titration of a weak acid with a strong base.
(a) Describe how the pH changes during the buffer region of the titration curve. (2 marks)
(b) Explain how the equivalence point can be identified using a pH meter rather than an indicator. (2 marks)
(c) State one reason why phenolphthalein is a suitable indicator for this titration. (1 mark)
(5 marks)
(5 marks)
(a) Buffer region of titration curve (2 marks)
pH changes only slowly / gradually as base is added. (1 mark)
Presence of both weak acid and its conjugate base forming a buffer. (1 mark)
(b) Use of a pH meter at equivalence point (2 marks)
pH meter shows a sharp change in pH at the equivalence point. (1 mark)
Does not rely on colour change, allowing accurate identification of the exact equivalence point. (1 mark)
(c) Indicator choice (1 mark)
Phenolphthalein changes colour in the steep pH range around the equivalence point for a weak acid–strong base titration. (1 mark)
FAQ
Dilution lowers the concentrations of both the weak acid and its conjugate base by the same factor.
Because the ratio of conjugate base to acid remains constant, the equilibrium position does not shift significantly.
As a result, the hydrogen ion concentration — and therefore the pH — changes very little, even though the solution is more dilute.
At the half-equivalence point, exactly half of the weak acid has been neutralised.
This means:
The concentrations of the weak acid and its conjugate base are equal.
The pH of the solution is equal to the pKa of the weak acid.
This point is useful experimentally for determining pKa values and confirming acid strength.
Buffers work by removing small amounts of added H⁺ or OH⁻ ions.
If too much acid or alkali is added:
One component of the buffer becomes fully used up.
The buffer equilibrium can no longer oppose the change.
Once this happens, the pH changes rapidly, and the solution no longer behaves as a buffer.
Biological systems require very precise pH control, often within a narrow range.
pH meters:
Detect very small pH changes.
Do not depend on colour changes.
Can be used in opaque or coloured solutions like blood.
This makes them essential for monitoring systems where even slight pH changes are significant.
Breathing controls the amount of carbon dioxide in the blood.
Faster breathing removes CO₂, reducing carbonic acid formation and increasing pH.
Slower breathing allows CO₂ to build up, increasing carbonic acid and lowering pH.
This provides a rapid, short-term mechanism for regulating blood pH via the carbonic acid–hydrogencarbonate buffer system.
