
AP Syllabus focus: ‘Use periodicity to estimate property values when data are unavailable and justify estimates using trends and electronic structure.’
Periodic trends let you make defensible estimates for missing atomic data by comparing an element to its neighbours. On the AP Exam, the goal is not exact numbers, but well-justified, trend-based reasoning.
What “using periodicity” means for missing data
Periodicity is the repeating pattern of properties as electron structure repeats across the periodic table.
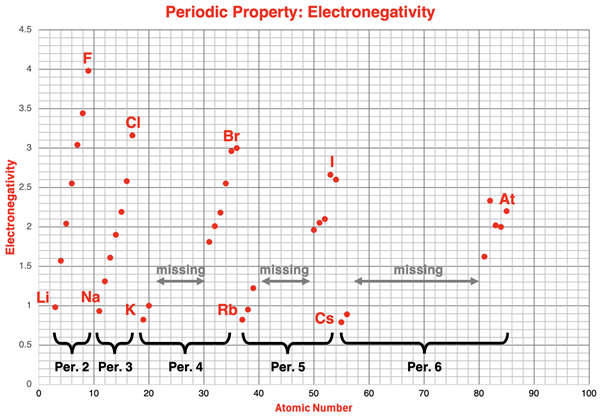
Electronegativity is plotted against atomic number for main-group elements, revealing the recurring rise across each period and the reset at the start of the next period. This visualization connects “periodicity” to electron structure: as valence shells fill across a period, atoms become more effective at attracting shared electrons, producing a repeating trend pattern. Source
When a value is missing (from a table, graph, or prompt), you estimate it by placing the element correctly in a trend and explaining why.
Periodicity: predictable, repeating patterns in elemental properties that arise from recurring valence-electron structures across periods and down groups.
A high-quality estimate has two parts:
A directional prediction (increase/decrease relative to nearby elements).
A justification tied to electronic structure (shells/valence electrons) and qualitative electrostatics (attraction between nucleus and electrons).
Core strategy for estimating a missing value
Step 1: Identify the property and its “usual” periodic behaviour
On AP Chemistry, missing-data estimates most often involve:
Ionisation energy
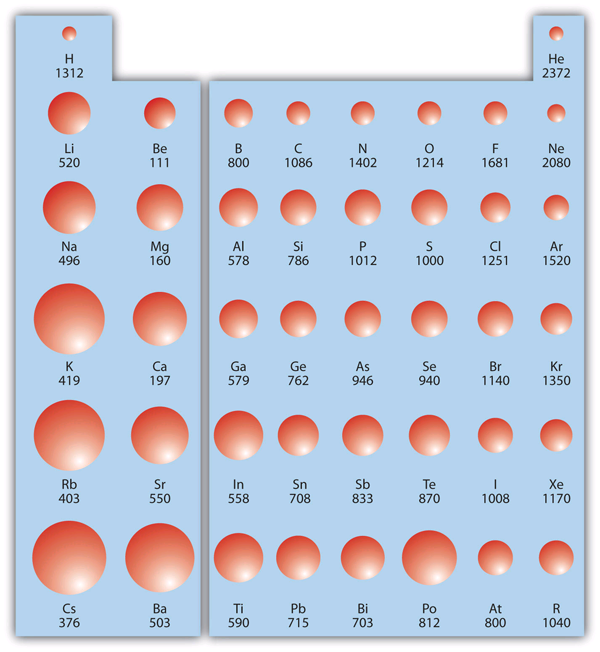
First ionization energies (kJ/mol) are displayed across the periodic table, with visual sizing emphasizing where electrons are held most tightly. The pattern supports trend-based justification: ionization energy generally increases left→right across a period (greater nuclear attraction within the same principal energy level) and decreases down a group (greater distance and shielding). Source
Atomic or ionic radius

Atomic radii (in picometers) are shown on a periodic-table layout, with sphere size scaling to atomic size. The figure highlights the core trend you use for estimates: radii generally decrease left→right across a period (increasing effective nuclear attraction within the same shell) and increase top→bottom down a group (additional shells and shielding). Source
Electronegativity
Electron affinity
You do not need precise memorised values; you need the correct relative placement and a defensible explanation.
Step 2: Anchor your estimate using nearby elements
Use “known” reference points:
Same period neighbours (left/right) for across-period comparisons.
Same group neighbours (above/below) for down-group comparisons.
If provided partial data, use the closest data points to bracket the unknown.
Useful bounding logic:
“The missing value should lie between the values of the adjacent elements” (when the trend is smooth across that region).
“The missing value should be larger/smaller than both neighbours” (when the element sits at an extremum of a trend).
Step 3: Justify using electronic structure language
Strong justifications explicitly mention:
Number of occupied shells (distance of valence electrons from the nucleus)
Valence electron configuration pattern within a period (same shell, changing nuclear charge)
Shielding as you move down a group (inner electrons reduce attraction felt by valence electrons)
Resulting changes in how strongly valence electrons are attracted to the nucleus
Estimation patterns you should be able to defend
Across a period (left → right)
When comparing elements in the same period, you are comparing valence electrons in the same principal energy level. Estimation is often defended by:
Increasing nuclear charge across the period with broadly similar shielding
Stronger attraction between the nucleus and valence electrons for elements further right
What this lets you do in practice:
Place a missing value between two known adjacent values if the trend is smooth.
Predict that many “attraction-related” properties tend to become more pronounced to the right (and sizes tend to contract).
Down a group (top → bottom)
When comparing elements in the same group, you are adding electron shells. Estimation is often defended by:
Greater average distance of valence electrons from the nucleus
Increased shielding from additional inner electrons
Practical consequences for estimates:
Size-related properties typically shift in a consistent direction down a group.
Properties tied to holding electrons tightly often weaken down a group.
Handling imperfect trends (how to stay AP-accurate)
Real periodic data can show small irregularities. For estimating missing data, you should:
Use the dominant periodic trend unless the prompt provides evidence of an exception.
Prefer relative reasoning (“greater than”, “less than”, “approximately similar to”) over claiming an exact value.
If a graph is given, follow the shape of the curve and match the missing point to the local pattern (increasing, decreasing, plateauing).
Writing a complete justification (what graders look for)
A complete AP-style justification typically includes:
A clear comparison target: “compared with element X (left/right/above/below)”
A trend statement: “property increases/decreases across/down”
An electronic-structure reason:
same shell vs additional shells
shielding changes
changes in nuclear attraction to valence electrons
Avoid vague statements like “because it is more reactive” unless you explicitly connect reactivity to electron attraction and valence structure.
Practice Questions
(2 marks) The electronegativity of element Q is missing from a data table. Q is located directly to the right of carbon in Period 2. Estimate whether Q’s electronegativity is higher or lower than carbon’s, and justify using periodicity and electronic structure.
1 mark: States electronegativity is higher than carbon.
1 mark: Justifies using periodicity/electronic structure (e.g., increased nuclear attraction across the period with same shell / similar shielding, so stronger pull on bonding electrons).
(5 marks) A table lists first ionisation energies for Period 3 elements but omits the value for silicon. The values for aluminium and phosphorus are provided. Using periodicity, estimate where silicon’s first ionisation energy lies relative to aluminium and phosphorus, and justify your estimate using trends and electronic structure. Include two distinct justification points.
1 mark: Correct ordering: .
1 mark: Uses across-period trend (ionisation energy generally increases left to right).
1 mark: Mentions same principal energy level for Period 3 valence electrons (same shell).
1 mark: Links to increased nuclear attraction across the period (greater nuclear charge / stronger attraction to valence electrons).
1 mark: Mentions shielding is roughly similar across the period (so change is mainly nuclear attraction), or otherwise provides a second distinct electronic-structure-based justification consistent with periodicity.
FAQ
Usually only relative placement is required (higher/lower, between two values, or correct ordering). If a number is requested, a reasonable approximation consistent with nearby data earns credit when well justified.
Prioritise the comparison that keeps electron structure most similar (same period for same shell). Then state which factor dominates (e.g., added shell and shielding down a group outweigh across-period changes).
Use comparative language tied to structure: “more shells”, “greater shielding”, “stronger nuclear attraction across the period”, and explicitly reference left/right or above/below positions.
Follow local behaviour: direction (increasing/decreasing), relative steepness, and whether the region is roughly linear. Anchor the missing point using the nearest plotted neighbours.
Purely descriptive phrases like “because it’s further right” without explaining electron structure. Add the mechanism: same shell + greater nuclear attraction, or more shells + more shielding, to secure the reasoning mark.
