
AP Syllabus focus:
‘Species richness is the number of different species present in an ecosystem.’
Species richness is a simple, widely used way to describe biodiversity patterns and compare ecosystems. Understanding what it captures (and what it misses) helps you interpret field data and environmental change accurately.
What species richness measures
Species richness focuses only on how many distinct species occur in a defined area, at a defined time. It treats each species equally, regardless of how common or rare it is.
Species richness: the number of different species present in an ecosystem (or in a specified area and time period).
Because richness is a count, it is sensitive to the boundaries you choose (plot size, habitat patch, watershed) and to the effort used to detect species.
A simple notation you may see
Richness is often represented by a single variable.
= count of distinct species (unitless)
How species richness is measured in practice
In environmental science, species richness is usually estimated from sampling, not complete censuses.
Common sampling approaches
Quadrat sampling: place a frame of known area and record all species inside (often for plants and slow-moving organisms).
Transects: record species along a line (line transect) or within a belt (belt transect) to capture changes across space.
Point counts and surveys: repeated observations for birds, mammals, or insects, often standardized by time.
What must be standardised for fair comparisons
To compare species richness between sites, keep methods consistent:
Sampling effort (number of quadrats, transect length, survey time)
Area sampled and habitat boundaries
Season/time of day (many species are seasonal or nocturnal)
Identification rules (lumping vs splitting similar species)
Interpreting species richness as a biodiversity measure
Species richness is high-utility because it is intuitive and can respond to environmental stress, land-use change, and management actions. However, it is only one dimension of biodiversity.
Strengths
Easy to communicate (a single number)
Useful for baseline inventories and tracking change over time
Helps identify hotspots (areas with many species)
Key limitations (what richness does not tell you)
No information about abundance: one individual counts the same as thousands.
No information about evenness: a community dominated by one species can have the same richness as a balanced community.
Detectability bias: rare, cryptic, small, or mobile species are more likely to be missed.
Scale dependence: richness usually increases as the area sampled increases, so “higher richness” can reflect larger sampling area rather than a truly more diverse ecosystem.
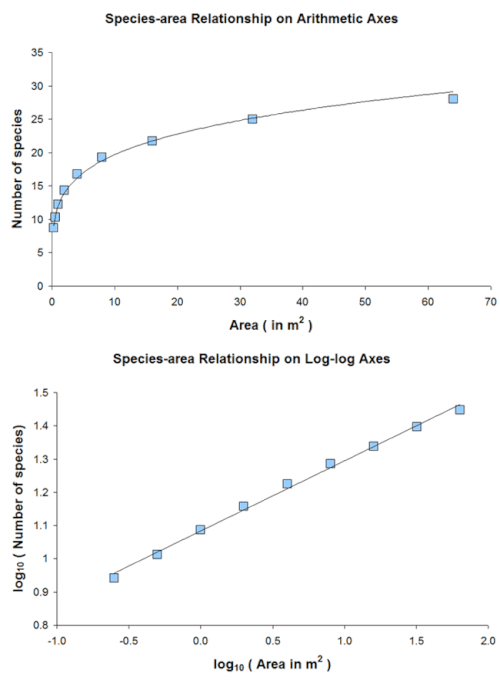
Species–area relationship (SAR) curve. The plot illustrates the general pattern that the number of species observed increases as the sampled area increases, often following a power-law form. This provides a visual rationale for why differences in plot size or habitat boundaries can strongly affect reported species richness. Source
Turnover through time: short surveys can miss migratory or episodic species, underestimating richness.
Good scientific practice when reporting richness
State the exact area, time period, and sampling method used.
Report whether richness is observed (what you saw) versus estimated (adjusted for likely missed species).
Interpret changes alongside context such as survey conditions, access constraints, and identification certainty.
Practice Questions
Define species richness. (2 marks)
States it is a measure of biodiversity based on a count of species (1)
Specifies it is the number of different species present in an ecosystem/defined area (1)
A student compares two wetlands and reports that Wetland A has higher species richness than Wetland B. Describe two reasons this comparison could be misleading, and for each reason state one way to improve the study design. (6 marks)
Any two valid reasons (1 mark each), plus a matched improvement (2 marks each), max 6:
Different sampling effort/duration; improve by standardising number of quadrats/transect length/survey time (reason 1, improvement 2)
Different area or boundaries sampled; improve by sampling equal areas or reporting richness per standard area (reason 1, improvement 2)
Seasonal/time-of-day differences affecting detectability; improve by surveying in the same season and time windows, repeated visits (reason 1, improvement 2)
Misidentification/cryptic species; improve by using expert verification, keys, or DNA barcoding where appropriate (reason 1, improvement 2)
Habitat heterogeneity differs; improve by stratified sampling across the same habitat types (reason 1, improvement 2)
FAQ
They may use species-accumulation approaches and richness estimators that account for undetected species.
Repeated samples build an accumulation curve
Estimators use the frequency of rare species (e.g., singletons) to infer missing taxa
Rarefaction is a standardisation method that compares richness at an equivalent sampling effort.
It helps separate “more species because we sampled more” from genuine differences between sites.
Yes, but interpretation changes because detectability, mobility, and survey methods differ.
Comparisons are most meaningful within a group using consistent protocols; cross-group comparisons are usually used to describe patterns, not rank “overall” biodiversity.
At small scales, richness reflects local conditions and microhabitats. At larger scales, it also reflects habitat variety and how communities differ from place to place.
Choosing scale should match the management question (e.g., site restoration vs regional planning).
Richness can remain stable if sensitive species are replaced by tolerant species, keeping the count similar while composition shifts.
This is why richness is often paired with additional descriptors (e.g., community composition metrics) in monitoring programmes.

.gif)