
AP Syllabus focus: ‘Instantaneous acceleration is the slope of a tangent line on a velocity-time graph, and displacement is the area under a velocity-time graph.’
Velocity–time graphs convert motion into a visual model you can read quantitatively.
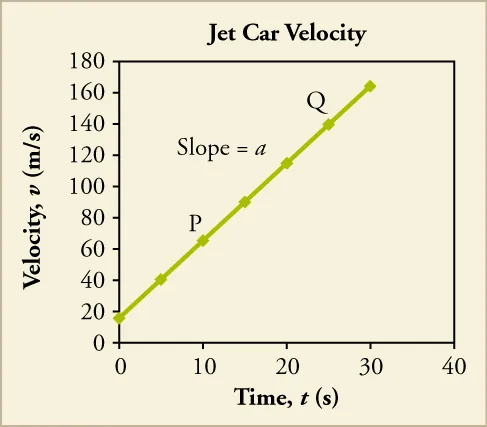
Velocity–time graphs encode two key kinematics ideas at once: the slope gives acceleration and the area under the curve gives displacement. The figure’s straight-line segments make it easy to compute area by simple geometry (rectangle + triangle), reinforcing why is found from signed area on a – graph. Source
In AP Physics 1, you must connect graph features to physical meaning using slope for acceleration and area for displacement, including signs.
Velocity–Time Graph Essentials
A velocity–time (v–t) graph plots velocity on the vertical axis and time on the horizontal axis. Because velocity is a vector in one dimension, points above or below indicate direction.
Reading direction and motion
: motion in the chosen positive direction
: motion in the negative direction
Crossing : the object changes direction (it is momentarily at rest at the crossing if the graph is continuous)
Slope of a v–t Graph: Instantaneous Acceleration
The slope tells how quickly velocity changes with time. On a curved graph, the slope depends on the instant you choose, so you use a tangent line.
Instantaneous acceleration: The acceleration at a specific moment in time; on a – graph, it equals the slope of the tangent line at that time.
This is exactly the syllabus idea: instantaneous acceleration is the slope of a tangent line on a velocity–time graph. A positive slope means acceleration in the positive direction; a negative slope means acceleration in the negative direction.
= acceleration, in
= change in velocity over the interval, in
= time interval, in
A steep slope (large magnitude) means velocity is changing quickly. A horizontal segment has zero slope, so during that interval.
Tangent vs. secant (why it matters)
Tangent slope: acceleration at one instant (instantaneous)
Secant slope: average acceleration over a time interval (connect two points with a straight line)
When the graph is a straight line, tangent and secant slopes match everywhere, indicating constant acceleration.
Area Under a v–t Graph: Displacement
The second syllabus requirement is that displacement is the area under a velocity–time graph. The key is that velocity multiplied by time gives a length, so graphical area corresponds to position change.
Displacement: The change in position over a time interval; on a – graph, it equals the signed area between the graph and the time axis.
Area is signed:
Area above the time axis () contributes positive displacement.
Area below the time axis () contributes negative displacement.
Net displacement equals (positive area) minus (magnitude of negative area).
= displacement over the interval, in
In practice, for piecewise straight graphs you typically find area by geometry:
Rectangle area corresponds to constant velocity.
Triangle or trapezoid areas correspond to linearly changing velocity. Be careful to include negative areas when the graph is below the axis.
What area does (and does not) tell you
The net area gives net displacement (where you end relative to where you started).
If you need total distance travelled, you would add the magnitudes of the areas above and below the axis (treat negative regions as positive). This is not the same as displacement when direction reverses.
Common Graph Interpretation Pitfalls
Confusing slope with height: height is velocity; slope is acceleration.
Forgetting that “area under the curve” is measured to the time axis, not to an arbitrary reference line.
Ignoring sign: negative velocity implies negative area, which subtracts from net displacement.
Using endpoints only on a curved graph: for instantaneous acceleration, you need the tangent at the time of interest.
Practice Questions
Q1 (3 marks) A velocity–time graph is a straight line from to . Determine the acceleration.
Uses slope idea: (1)
(1)
(1)
Q2 (6 marks) A velocity–time graph consists of two segments: from to , velocity increases linearly from to ; from to , velocity is constant at .
(a) Find the acceleration during to .
(b) Find the displacement from to using area under the graph.
(a) stated (1)
(a) and (1)
(a) (1)
(b) Displacement is signed area under – graph stated (1)
(b) Area from 0 to 3 s as trapezium: (1)
(b) Area from 3 to 5 s as rectangle: ; total (1)
FAQ
Draw a tangent at the time of interest, then pick two well-separated points on that tangent and compute $\Delta v/\Delta t$. A longer run along the tangent reduces reading error.
Area and slope still work, but you must use the axis values carefully. Count grid squares only after converting using the stated scales (e.g., $1$ square $=0.5,\text{m s}^{-1}$ vertically).
Yes. If the positive and negative areas under the $v$–$t$ graph cancel, net displacement is $0,\text{m}$ even though motion occurred.
Because velocity carries direction in 1D. When $v<0$, the object moves opposite the positive axis, so the corresponding area must subtract from the net change in position.
Interpolate linearly along the segment to locate the crossing time, then split the area into pieces above and below the axis. This improves both the sign and magnitude of the displacement.
