
AP Syllabus focus: ‘The change in velocity during a time interval equals the area under an acceleration-time graph.’
Acceleration–time graphs connect a motion description to measurable changes in velocity.
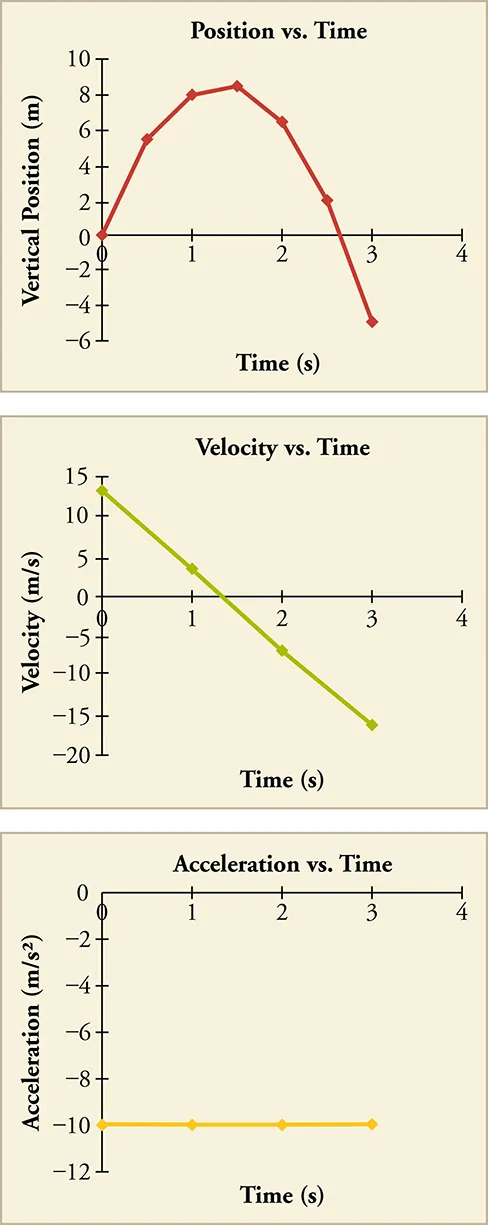
Acceleration–time and velocity–time graphs for the same motion, with axes and units explicitly labeled. Reading the acceleration at each instant from the plot explains why the velocity changes linearly when acceleration is constant. This pairing reinforces that the change in velocity over an interval is , i.e., the signed area under the – curve. Source
By interpreting graph features and signed area, you can determine how an object’s velocity evolves over a time interval without solving full kinematics.
Core relationship: area gives change in velocity
When acceleration varies with time, the change in velocity over a chosen interval is determined by the signed area between the acceleration curve and the time axis.
Change in velocity (): The final velocity minus the initial velocity over a time interval; it can be positive or negative depending on direction.
A positive area corresponds to an increase in the velocity component defined as positive in your coordinate choice; a negative area corresponds to a decrease.
= change in velocity over the interval, in
= acceleration as a function of time, in
= initial and final times, in
This equation is an “area statement”: acceleration () multiplied by time () produces velocity units ().
Reading an acceleration–time graph correctly
What the axes mean
Vertical axis: acceleration (can be above or below zero)
Horizontal axis: time
The graph’s value at a particular time is the acceleration at that instant.
Signed area and direction
Treat area above the time axis as positive and area below as negative.
If the curve is entirely above zero, the object’s velocity becomes more positive over time.
If the curve is entirely below zero, the object’s velocity becomes more negative over time.
If it crosses zero, the net depends on the balance of positive and negative areas.
Net vs total change
Net change in velocity uses signed area (positive and negative can cancel).
If you are ever asked for the magnitude of the change, take after finding the signed result.
Finding area in AP Physics 1 Algebra
AP Physics 1 Algebra typically uses shapes and arithmetic to determine area under an – graph.
Piecewise-constant acceleration (rectangles)
If acceleration is constant over a segment:
Area = (height) (width)
Here, height is and width is
= change in velocity during the segment, in
= constant acceleration on that segment, in
= duration of the segment, in
Between equation boxes, remember the practical interpretation: each segment contributes a “velocity gain” (or loss) that you add to get the total .
Linearly changing acceleration (triangles and trapezoids)
If changes linearly between two values, the area is found using basic geometry:
Triangle area:
Trapezoid area: average height base
Keep careful track of sign: a “triangle” below the axis still contributes negative area.
Curved acceleration graphs
If the curve is not a line:
You may be expected to estimate area by counting grid squares or using “thin rectangle” reasoning.
The physics idea stays the same: more area means a larger change in velocity.
Connecting area to velocity updates
Often you know an initial velocity and want the final velocity after interpreting the acceleration–time graph.
Final velocity (): The velocity at the end of the interval, found by adding the interval’s to the initial velocity.
Use the update rule: . Conceptually, the graph supplies ; your initial condition supplies the starting point.
Common pitfalls to avoid
Mixing up area with slope: on an – graph, slope is “change in acceleration,” not directly .
Forgetting units: area must come out in .
Ignoring sign conventions: negative acceleration does not automatically mean “slowing down”; it means acceleration in the negative direction of your chosen axis, and the area sets the sign of .
Practice Questions
Q1 (1–3 marks) An object’s acceleration is constant at from to . Determine the change in velocity over this time.
Uses (1)
Substitutes and (1)
with correct unit (1)
Q2 (4–6 marks) An acceleration–time graph consists of two segments: from to , ; from to , . The initial velocity is . Find (i) the net change in velocity from to and (ii) the final velocity.
Calculates area/segment 1: (1)
Calculates area/segment 2: (1)
Net change: (1)
Uses (1)
with correct sign and unit (1)
FAQ
Because acceleration is the time-rate of change of velocity. Accumulating (adding up) acceleration over time gives the total change in velocity, not the absolute velocity.
In calculus language, $\Delta v$ is the time integral of $a(t)$, which geometrically is area.
Use numerical area estimation:
Split the interval into narrow time strips
Approximate each strip as a rectangle (or trapezoid)
Add the signed areas
Finer strips generally improve the estimate.
Compute signed areas on each sub-interval separated by crossings, then add them.
Crossings indicate moments when acceleration is zero; they do not by themselves determine whether velocity is zero.
Area depends on the axis scales. One “grid box” represents $(\Delta a)(\Delta t)$ in units of $\mathrm{m/s^2}\cdot\mathrm{s}=\mathrm{m/s}$.
Always read the numerical tick marks before counting squares.
Yes. Any two graphs with the same net signed area over the interval produce the same $\Delta v$.
They may still lead to different velocities at intermediate times, but the final minus initial velocity is identical.
