
AP Syllabus focus: ‘Motion can be represented with motion diagrams, figures, graphs, equations, and narrative descriptions.’
Representing motion in multiple ways helps you organise observations, communicate clearly, and check for consistency. In AP Physics 1, you should be able to translate between words, pictures, graphs, and equations.
The big idea: one motion, many representations
A single physical event (an object moving) can be described using several complementary tools. Each highlights different information:
Narrative descriptions emphasise sequence and direction in everyday language.
Figures and motion diagrams emphasise spatial relationships and timing.
Graphs emphasise how a quantity changes over an interval.
Equations compactly encode relationships between variables.
Using more than one representation is a powerful error-check: if two representations imply different behaviour, at least one is inconsistent.
Narrative descriptions (words)
A narrative description states, in order, what the object does and how its motion changes.
Include a direction convention (for example, “to the right is positive”) when direction matters.
Use precise motion terms: speeding up, slowing down, moving in the positive direction, reversing direction, at rest.
Separate “where it is” from “how it is moving”:
position-related statements (“starts at the origin,” “ends left of the start”)
motion-related statements (“moves right quickly, then slows”)
Narratives are especially useful when interpreting lab observations or describing what a graph “means” in words.
Figures (pictures of the situation)
A figure is a labelled sketch of the physical setup. It supports the object-and-environment model without adding extra physics.
Draw the object as a dot when size/shape is irrelevant.
Include a simple coordinate line with an origin and positive direction.
Label key locations (start, end, landmarks) and any given distances.
Figures are not the same as motion diagrams: a figure shows the setup; a motion diagram shows the motion over time.
Motion diagrams (pictures of motion over time)
Motion diagram: A sequence of particle-like dots showing an object’s position at equal time intervals, often with velocity arrows to indicate direction and relative speed.
In a motion diagram:
Each dot corresponds to the object’s position at a successive, equal time step.
Spacing between dots encodes how fast the position is changing:
increasing spacing suggests the object is speeding up
decreasing spacing suggests the object is slowing down
equal spacing suggests steady motion
Optional arrows can be added:
velocity arrows point in the direction of motion; longer arrows indicate larger speed
Motion diagrams are excellent for connecting physical intuition (what you “see” happening) to more abstract representations like graphs.
Graphs (visual patterns in data)
Graph: A plot showing how one measured or calculated quantity changes with another (most commonly time), revealing patterns such as steady change, rapid change, or reversals.
Common motion graphs place time on the horizontal axis and plot a motion quantity on the vertical axis (such as position or velocity).
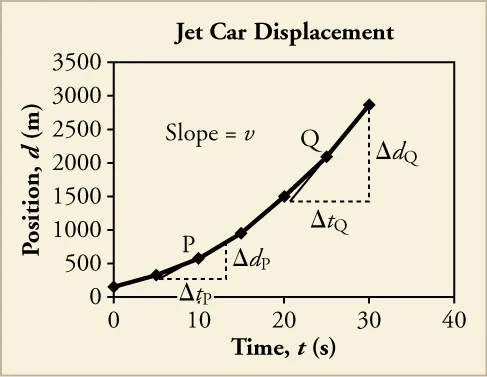
A position–time graph communicates motion through its slope: a steeper slope indicates a larger velocity, and a changing slope indicates changing velocity. The curved – example (speeding up) visually connects “increasing spacing in a motion diagram” to an increasing slope on the graph, and the tangent lines illustrate instantaneous velocity as the slope at a point. Source
For this subtopic, focus on what graphs communicate qualitatively:
A graph shows whether a quantity is constant, increasing, decreasing, or changing irregularly.
Where the graph crosses zero can indicate sign changes, which often align with reversals in direction (depending on what is graphed).
Curved vs straight segments suggest different kinds of change over time.
Graph shape should match the narrative and the motion diagram; for example, a reversal in direction should appear consistently across representations.
Equations (compact relationships)
Equations are a concise way to represent motion using symbols and units.
Define each symbol clearly (including sign conventions).
Use equations to connect known and unknown quantities and to check dimensional consistency.
Even without solving, an equation can show proportionalities (what increases when something else increases).
Equations should not be used in isolation; they should agree with the story told by figures, diagrams, and graphs.
Translating between representations (a practical workflow)
Start with a figure: set an origin and positive direction.
Write a narrative using consistent sign and direction language.
Create a motion diagram matching the narrative timing and direction.
Sketch a qualitative graph that matches the motion diagram’s spacing patterns.
If needed, choose an equation form that matches the relationships implied by the graph and diagram.
Practice Questions
(2 marks) State two different ways to represent motion used in AP Physics 1 and give one advantage of each representation.
Any two from: narrative description, figure, motion diagram, graph, equation (1 mark each)
One valid advantage matched to each chosen representation, e.g. “motion diagram shows timing via equal intervals” or “graph reveals trends over time” (1 mark total, must be linked)
(5 marks) A trolley moves to the right along a straight track. It starts slowly, speeds up for a while, then moves at a steady speed.
(a) Write a clear narrative description including a sign convention. (2 marks)
(b) Describe how you would draw a motion diagram for this motion (what happens to dot spacing and any arrows). (3 marks)
(a)
States a sign convention, e.g. “right is positive” (1)
Describes the sequence: slow to the right, then speeding up, then constant speed (1)
(b)
Equal time interval dots stated or implied (1)
Dot spacing increases during speeding up phase (1)
Dot spacing becomes equal during constant-speed phase; optional velocity arrows point right and increase then become equal length (1)
FAQ
Pick axes that comfortably fit the full time interval and expected range.
Use simple increments (1, 2, 5, 10) and label units clearly.
Using unequal time steps between dots.
If time steps are not equal, changing dot spacing no longer cleanly represents speeding up or slowing down.
Use a figure to show the physical layout (start point, landmarks, axis direction).
Use a motion diagram to show how position changes over equal time intervals.
Look for matching “events”: starting at rest, speeding up, constant behaviour, reversals.
Each event should appear in both representations at the same relative time.
Yes.
An equation can communicate relationships, sign conventions, and which quantities are changing, and it can be used to verify that a proposed graph or diagram is physically plausible.
