AP Syllabus focus: 'Electric field vector maps and equipotential lines describe fields produced by charges and can be used to predict the motion of charged objects.'
Electric fields are invisible, so physicists rely on diagrams that turn field behavior into patterns. Two of the most useful representations are electric field vector maps and equipotential lines.
Electric field vector maps
An electric field vector map displays the field at many selected locations so you can see how the field changes from point to point around one or more charged objects.
Electric field vector map: A diagram that uses arrows at selected points to represent the electric field. Arrow direction shows the local field direction, and arrow length shows relative field magnitude.
Because a vector map samples many positions, it gives more information than a single arrow at one point. It helps you decide where the field is stronger, how its direction varies, and whether a charged object would experience the same field behavior everywhere.
How to read a vector map
Each arrow is drawn at a specific location in space.
The arrow direction shows the direction of the electric field at that location.
The arrow length shows the relative magnitude of the field compared with other points on the same map.
If nearby arrows point in almost the same direction and have similar lengths, the field changes only a little across that region.
If the arrows change direction or size noticeably from one place to another, the field is nonuniform.
A vector map is especially useful near multiple charges, where the net field can vary greatly across a small region. Around a single isolated charge, the pattern is more symmetric. Around two or more charges, the arrows can form a more complicated arrangement because the field at each point depends on the combined effect of all source charges.
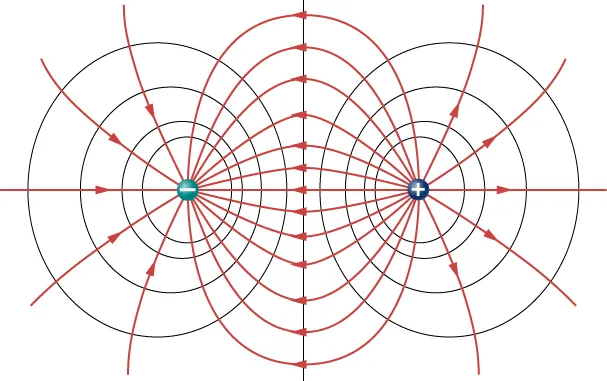
Field lines run from the positive charge to the negative charge, with line density indicating stronger electric fields near the charges. The equipotential curves (constant ) bend around both charges and remain perpendicular to the field lines at each intersection. This combined view makes it easier to connect field direction with how electric potential changes in space. Source
What a vector map does not show
A vector map does not mean a particle must move exactly along one drawn arrow. Each arrow only describes the field at one location. As a charged object moves, it enters new locations where the field may have a different direction or different magnitude. For that reason, the object’s path can bend even if its initial acceleration points in one clear direction.
Equipotential lines
A second way to represent the same field is with equipotential lines.
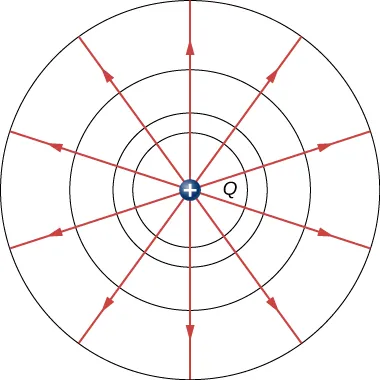
Electric field lines radiate outward from a positive point charge, indicating the direction a positive test charge would accelerate. The concentric circles are equipotential lines (constant ), drawn everywhere perpendicular to the field lines. The closer spacing of equipotentials near the charge corresponds to a larger electric field magnitude in that region. Source
Equipotential line: A line connecting points that all have the same electric potential.
These lines focus on electric potential rather than direct force information. Instead of asking, “Which way does the field point here?” an equipotential diagram asks, “Which points share the same potential value?”
What equipotential lines help you see
Points on the same equipotential line are equivalent in electric potential.
Different equipotential lines represent different potential values.
A set of equipotential lines shows how potential changes from place to place around the source charges.
The shape of the lines depends on the arrangement of the charges producing the field.
For a single isolated charge, equipotential lines in a two-dimensional diagram form a symmetric pattern around the charge. For more complex charge arrangements, the lines distort into less regular shapes. That makes equipotential lines a useful visual tool for comparing regions that may be close together on the page but electrically different.
Equipotential lines are part of a model. They are not physical tracks in space, and a charged particle is not required to follow one. Their purpose is to organize the electric environment into regions of equal potential.
Using both diagrams together
Field vector maps and equipotential lines describe the same field from two complementary viewpoints. A vector map emphasizes direction and relative strength at specific points. An equipotential map emphasizes the potential pattern across the region.
When both are shown together, they provide a stronger picture of the field produced by charges:
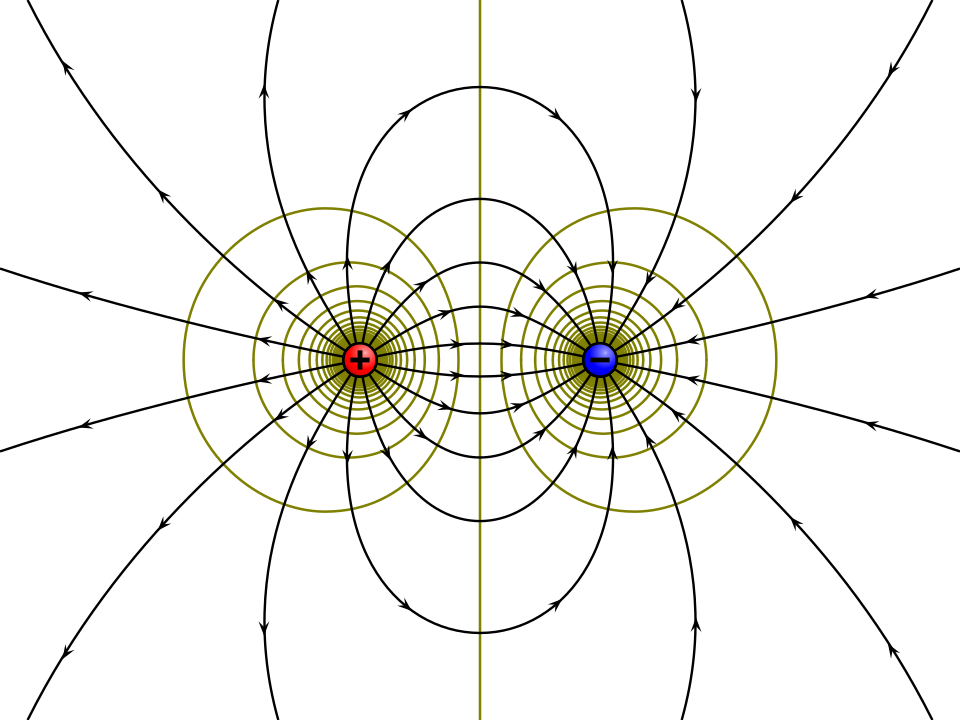
A positive–negative pair creates a dipole field whose lines curve from to , showing how the net field direction changes across space. The equipotential curves form a nested pattern that is everywhere orthogonal to the field lines, visually encoding the relationship . Because it is an SVG, the labels and curves remain sharp at any zoom level. Source
First identify whether the moving object is positively charged or negatively charged.
Then locate its starting position on the diagram.
Read the local field vector at that point.
A positive charged object initially accelerates in the direction of the electric field.
A negative charged object initially accelerates opposite the electric field direction.
Next, inspect how the surrounding vectors change from point to point. If their directions vary across the region, the object’s path will tend to curve rather than remain straight.
Use the equipotential pattern to identify whether the object is moving into a region with a different potential.
These diagrams are most useful for qualitative prediction. They let you infer initial motion, likely curvature of a path, and whether two positions are electrically alike or different, even before doing any algebra.
Predicting motion in practice
Suppose a small charged object is released from rest at a point on the map. The vector at that point tells you the initial acceleration direction. If later vectors in nearby regions point differently, the acceleration direction will change as the object moves. That is why motion in an electric field is often easier to visualize from a field map than from words alone.
Equipotential lines add another layer of interpretation. If two points lie on the same equipotential line, they share the same potential. If the object moves from one equipotential line to another, it has entered a region with a different potential. That helps distinguish between positions that may appear similar geometrically but are not electrically equivalent.
Why both representations matter
On AP Physics 2 Algebra questions, diagrams often carry essential information. A careful reading of vector directions, relative arrow lengths, and equipotential patterns can reveal:
where a charged object will begin to move,
whether two positions are electrically equivalent,
whether motion is likely to stay straight or become curved,
and how the arrangement of charges shapes the field around them.
In many problems, switching between these two visual tools gives the clearest picture of how charged objects behave in the electric field.
Practice Questions
At point P on an electric field vector map, the arrow points directly to the right. A small positive charge is released from rest at P.
State the direction of its initial acceleration and explain briefly.
States that the initial acceleration is to the right. (1)
Explains that a positive charge accelerates in the direction of the electric field at its location. (1)
On a combined diagram, points A and B lie on the same equipotential line. At point A, the local electric field vector points upward and slightly to the right. In the region above A, nearby field vectors turn more to the right than upward.
(a) What does the equipotential line tell you about points A and B? (1)
(b) A small positive charge is released from rest at A. State its initial acceleration direction. (1)
(c) Explain why its path is not expected to remain a straight line in the upward-right direction as it moves. (2)
(d) How would the initial acceleration differ if the released charge were negative instead? (1)
(a) States that A and B are at the same electric potential. (1)
(b) States that the initial acceleration is upward and slightly to the right. (1)
(c) Explains that the electric field direction changes from point to point. (1)
(c) Explains that the acceleration changes as the particle moves into new regions, so the path curves rather than staying straight. (1)
(d) States that a negative charge would initially accelerate in the opposite direction, downward and slightly to the left. (1)
FAQ
A real electric field exists in three-dimensional space, but a page shows only a two-dimensional view. That means the equipotential lines you see are usually cross-sections of larger equipotential surfaces.
A circular pattern on paper, for example, may represent part of a spherical pattern in space. The diagram is still useful, but it is only one slice of the full situation.
No. If two equipotential lines crossed, the crossing point would have to be at two different potentials at the same time.
That is impossible, because electric potential at a single point has only one value. If a drawing appears to show crossing equipotential lines, the diagram is incorrect or the lines represent different separate situations.
The numbers give the actual potential values of the lines, such as 5 V or 10 V, rather than showing only that the lines are different.
This helps you compare locations more precisely. Without numbers, you can still tell whether two points are on the same or different equipotential lines, but you may not know how large the potential difference is.
A vector map shows the field at selected sample points, not at every point in space. So a sparse region does not mean the field disappears there.
Instead, use the nearby arrows to estimate the local pattern. The map is a visual model, so you often need to interpolate between the arrows that are actually drawn.
For two like charges, the equipotential pattern tends to show symmetry that reflects the similar sources. The lines bend around both charges in a way that emphasizes their shared sign.
For two opposite charges, the pattern changes much more dramatically between the charges. The equipotential layout reflects the strong contrast between the two sources, so the map often looks less like two separate regions and more like one connected field structure.