
AQA Specification focus:
‘Both the short-run Phillips curve and the long-run, L-shaped Phillips curve.’
Introduction
The short-run Phillips curve (SRPC) explores the relationship between unemployment and inflation. It shows short-term trade-offs policymakers face when managing economic objectives.
Understanding the Short-Run Phillips Curve
The short-run Phillips curve illustrates an inverse relationship between the rate of unemployment and the rate of inflation in the short run. It suggests that when unemployment falls, inflation tends to rise, and vice versa.
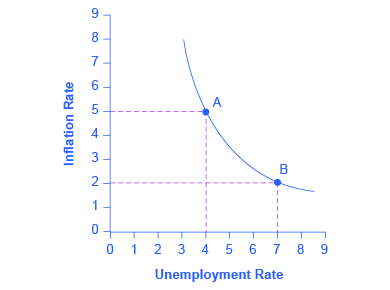
This graph depicts the short-run Phillips curve, showing the negative correlation between unemployment and inflation. It demonstrates how, in the short run, lower unemployment rates are associated with higher inflation rates, and vice versa. Source
Short-Run Phillips Curve (SRPC): A graphical representation showing the short-run inverse relationship between unemployment and inflation.
This idea originated from A.W. Phillips in 1958, who observed a consistent negative correlation between wage inflation and unemployment in the UK. His findings were extended to price inflation and unemployment, forming the basis of the curve.
Why the Trade-Off Exists
The SRPC trade-off can be explained through aggregate demand (AD) and aggregate supply (AS) analysis:
When AD increases, firms employ more workers to meet higher demand.
As unemployment falls, labour markets tighten, giving workers bargaining power to demand higher wages.
Higher wages increase production costs, which firms pass on as higher prices (inflation).
Conversely, if unemployment is high, there is less wage pressure, leading to lower inflation.
This relationship explains the downward-sloping SRPC.
Linking to Macroeconomic Objectives
The SRPC highlights a potential conflict between macroeconomic policy objectives. Policymakers often aim for both low unemployment and low inflation, but the SRPC suggests achieving one may worsen the other in the short run.
Low unemployment → higher inflation pressures.
Low inflation → risk of higher unemployment.
This makes the SRPC central to debates on policy trade-offs.
Shifts in the Short-Run Phillips Curve
The SRPC is not fixed; it shifts when expectations and external conditions change.
This diagram shows how the short-run Phillips curve shifts in response to changes in inflation expectations. An increase in expected inflation shifts the curve upward, indicating higher inflation at each unemployment rate. Source
Factors that shift the SRPC:
Inflation expectations: If people expect higher inflation, workers demand higher wages, shifting the SRPC upward.
Supply-side shocks: Oil price rises or commodity shocks can shift the SRPC, causing higher inflation at each level of unemployment.
Productivity changes: Faster productivity growth can reduce cost pressures, shifting the SRPC downward.
Expectations and the Phillips Curve
Economists recognised that the SRPC could not be stable indefinitely. In the 1970s, the UK and many advanced economies experienced stagflation — high unemployment and high inflation — challenging the original Phillips curve.
Stagflation: A situation where an economy experiences high inflation and high unemployment simultaneously.
This led to the incorporation of expectations into the Phillips curve model. Workers and firms adjust behaviour if they anticipate future inflation, reducing the effectiveness of demand-side policies.
Adaptive vs Rational Expectations
Adaptive expectations: People form future inflation expectations based on past inflation. If inflation rises steadily, expectations adjust slowly, shifting the SRPC upwards over time.
Rational expectations: People use all available information, predicting policy outcomes quickly. This means the SRPC may shift immediately, limiting any unemployment gains from inflationary policy.
Policy Implications of the SRPC
The SRPC has significant implications for macroeconomic management:
Policymakers may use expansionary fiscal or monetary policy to reduce unemployment, but this risks higher inflation.
Attempting to exploit the SRPC repeatedly leads to accelerating inflation, as expectations adjust upwards.
The trade-off is therefore temporary: in the long run, attempts to maintain unemployment below its natural rate only generate higher inflation.
Natural Rate of Unemployment: The level of unemployment consistent with stable inflation, where the economy is at full employment given structural factors.
Distinction from the Long-Run Phillips Curve
The short-run Phillips curve differs from the long-run Phillips curve (LRPC):
SRPC: Downward sloping, showing a temporary trade-off between unemployment and inflation.
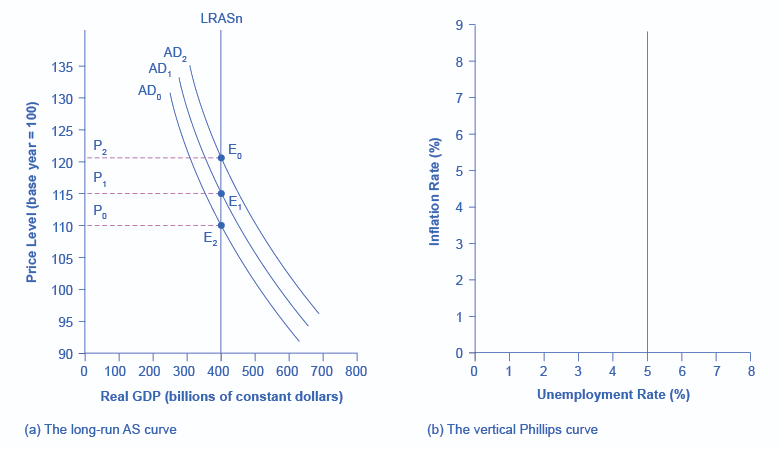
LRPC: Vertical at the natural rate of unemployment, showing no trade-off in the long run.
Thus, while the SRPC is useful in understanding short-term dynamics, it cannot be relied upon for long-term policy.
Key Takeaways for Students
The SRPC illustrates the short-term inverse relationship between unemployment and inflation.
It reflects demand-side influences and labour market pressures.
Shifts in the SRPC are caused by expectations and supply shocks.
The trade-off is temporary; in the long run, the Phillips curve becomes vertical at the natural rate of unemployment.
Practice Questions
Define the short-run Phillips curve and state the relationship it shows between unemployment and inflation. (2 marks)
1 mark for correctly defining the short-run Phillips curve (e.g., “a curve showing the short-run inverse relationship between unemployment and inflation”).
1 mark for stating the relationship (e.g., “as unemployment falls, inflation tends to rise, and as unemployment rises, inflation tends to fall”).
Explain how inflation expectations can cause the short-run Phillips curve to shift. (6 marks)
1–2 marks: Basic explanation that inflation expectations influence wage demands and price-setting behaviour.
3–4 marks: Clear explanation that higher expected inflation causes workers to demand higher wages, raising production costs and shifting the SRPC upwards.
5–6 marks: Developed explanation that expectations reduce the stability of the SRPC, meaning any attempt to reduce unemployment below the natural rate leads to accelerating inflation, illustrated with reference to a shift of the curve.
FAQ
The oil shocks of the 1970s created stagflation — high inflation combined with high unemployment — which contradicted the simple inverse relationship suggested by the SRPC.
This period demonstrated that supply-side shocks could shift the SRPC, making the trade-off between unemployment and inflation less reliable for policymakers.
The natural rate of unemployment represents the level at which inflation remains stable.
If policymakers attempt to reduce unemployment below this level using demand-side policies, the SRPC will shift upwards due to rising inflation expectations, making the trade-off unsustainable.
It highlights short-term trade-offs that governments face between reducing unemployment and controlling inflation.
Policymakers must weigh these objectives carefully, as short-term unemployment gains may trigger long-term inflationary pressures, reducing the effectiveness of repeated expansionary policies.
Supply-side shocks, such as increases in global oil prices, raise production costs across the economy.
This causes inflation to rise at any level of unemployment, shifting the SRPC upwards and reducing its usefulness as a policy guide.
Wage negotiations influence inflation directly.
If workers expect inflation to rise, they demand higher wages to protect real income.
Firms raise prices to cover increased wage costs, leading to higher inflation.
This mechanism helps explain why inflation expectations shift the SRPC.
