
AQA Specification focus:
‘Concentration ratios and how to calculate a concentration ratio.’
Concentration ratios measure the dominance of firms in a market, showing how much of total sales, output, or revenue is controlled by the largest companies.
Understanding Concentration Ratios
Concentration ratios are widely used in industrial economics to determine the extent of market power and competition. They provide an indication of how competitive or monopolistic a market is by examining the share of total output or sales accounted for by the largest firms.
Concentration Ratio: A measure showing the proportion of a market’s total sales, revenue, or output controlled by a specified number of the largest firms.
For AQA A-Level Economics, students must know both the concept of concentration ratios and the calculation method.
Levels of Concentration
A concentration ratio typically refers to the combined market share of the largest n firms, often expressed as:
CR4: The market share of the largest 4 firms.
CR5: The market share of the largest 5 firms.
CR10: The market share of the largest 10 firms.
The choice of ratio depends on the industry and data availability. For example, CR4 is common in UK and EU competition analysis.
Interpreting Concentration Ratios
High Concentration Ratios
A high concentration ratio (e.g., CR4 = 85%) suggests:
The largest firms dominate the market.
Limited competition, as smaller firms have low influence.
Greater potential for collusion or oligopolistic behaviour.
Low Concentration Ratios
A low concentration ratio (e.g., CR4 = 25%) indicates:
A fragmented, competitive market.
Many small firms competing.
Little scope for collusion, with firms behaving as price takers in some cases.
Calculation of Concentration Ratios
The formula requires adding together the market shares of the specified number of leading firms.
Concentration Ratio (CRn) = Sum of market shares of the largest n firms
Market Share (%) = (Firm’s Sales ÷ Total Market Sales) × 100
The concentration ratio (CRn) measures the combined market share of the largest n firms in an industry.
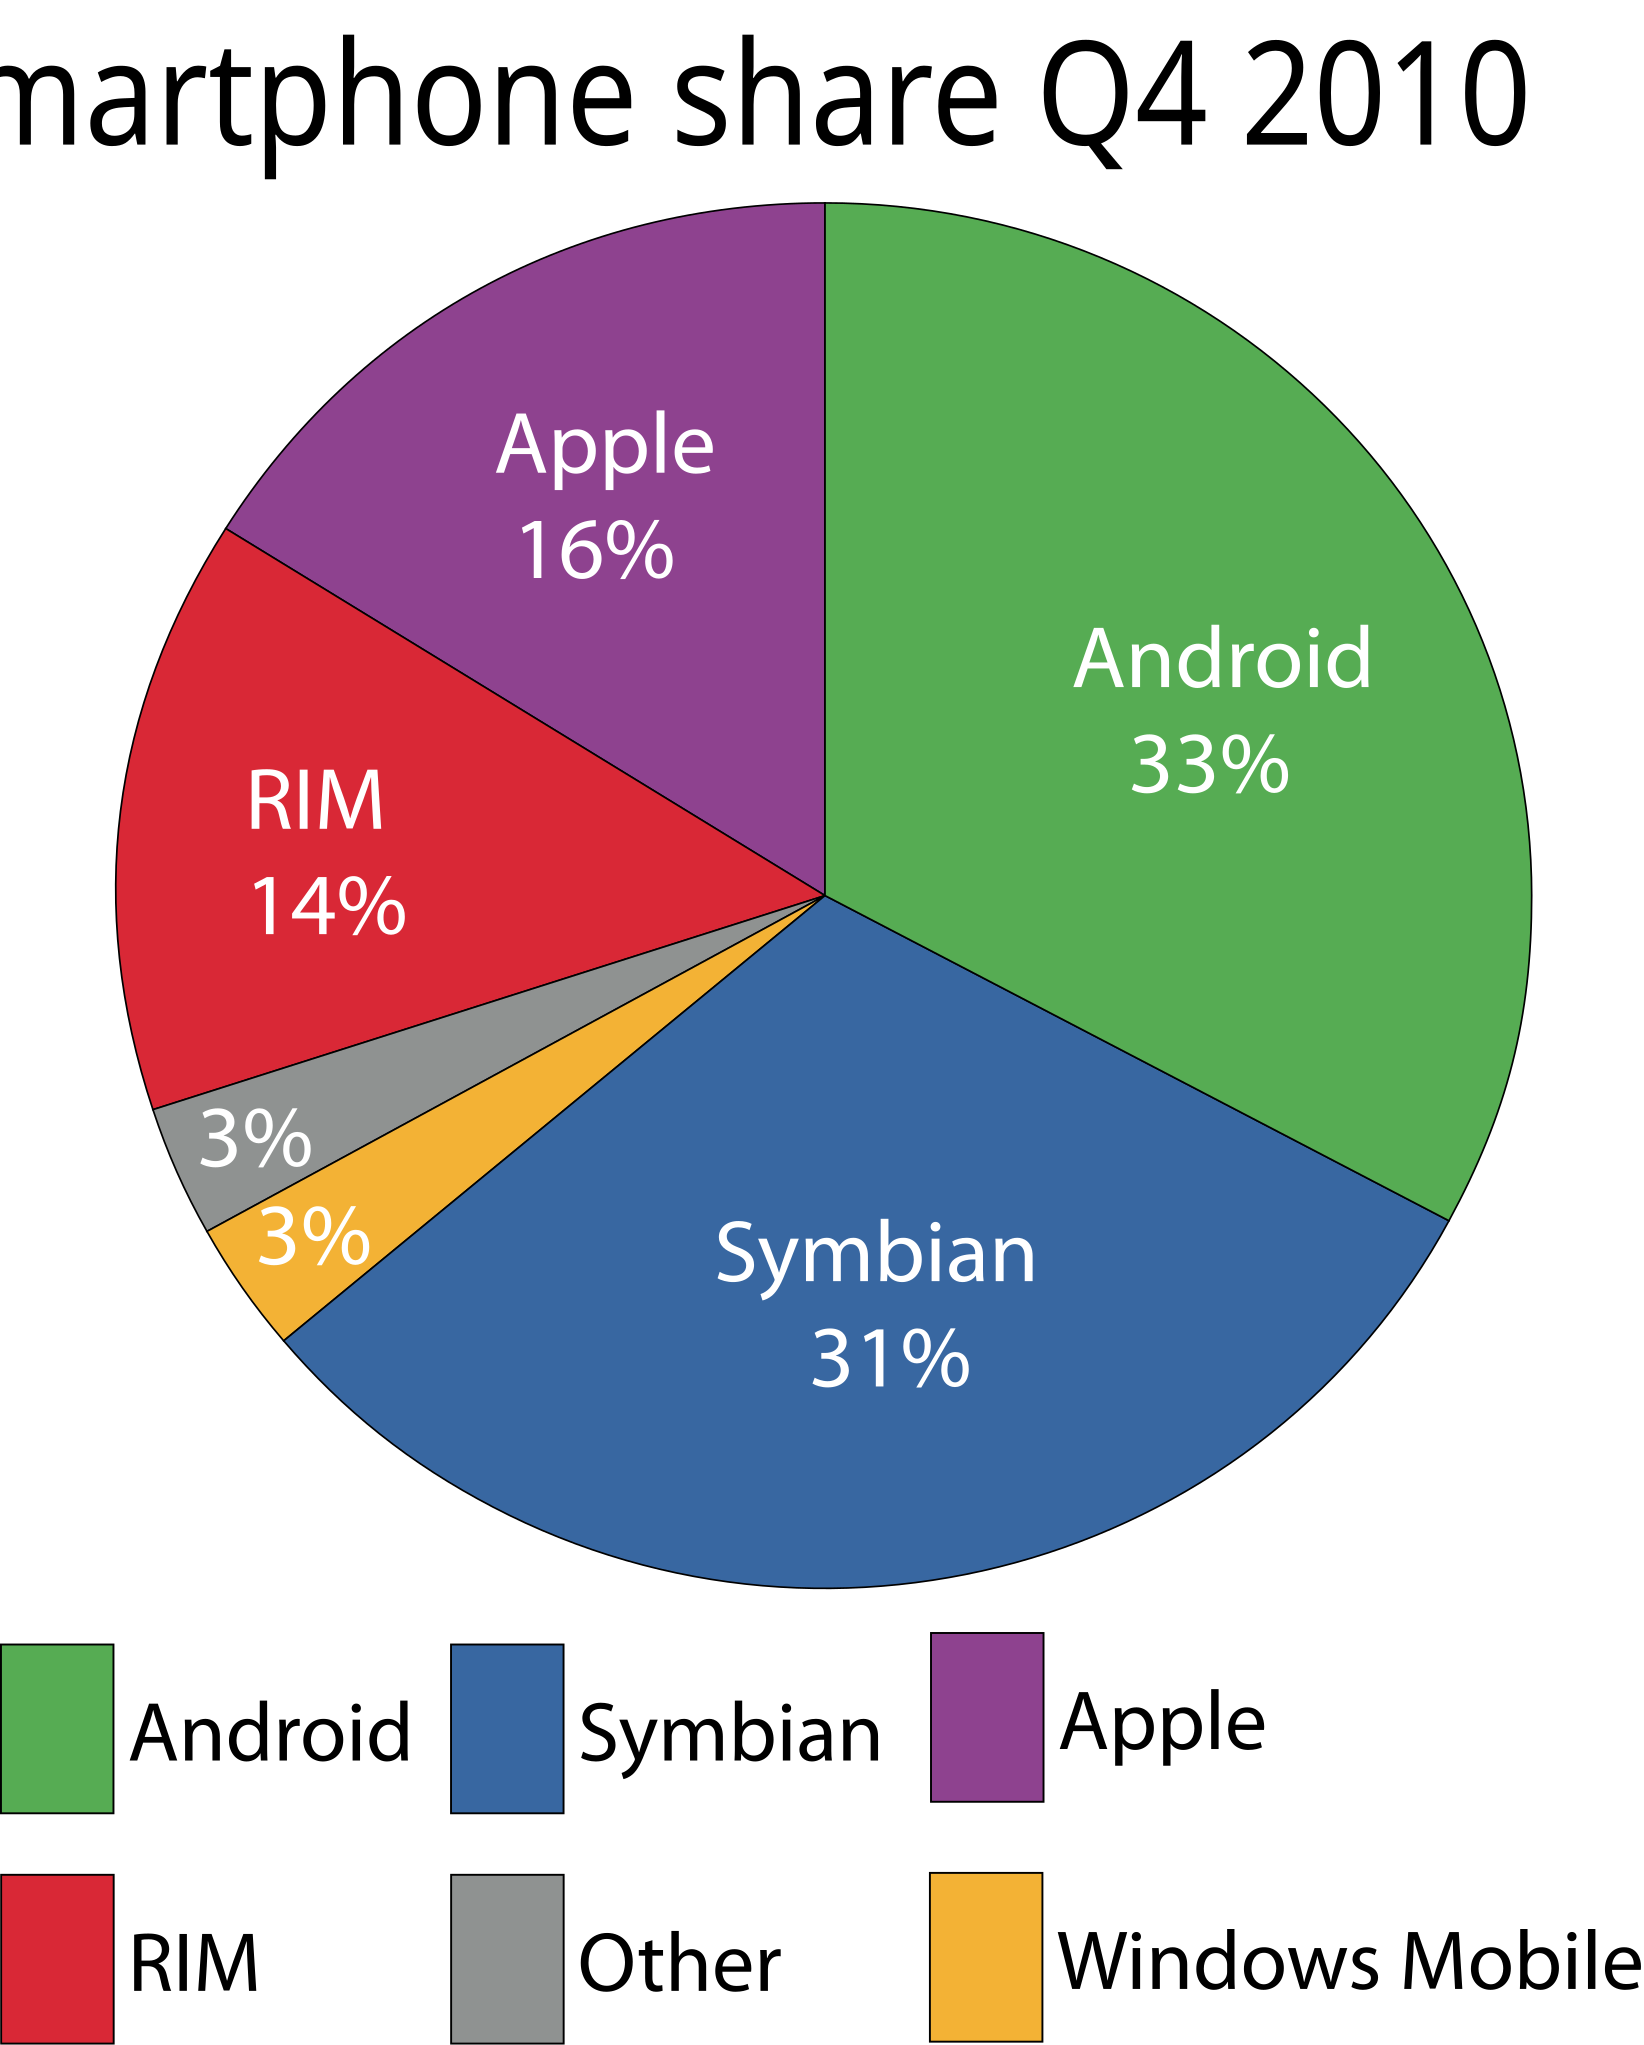
A labelled pie chart of market shares in a single industry snapshot. Summing the largest n slices yields the n-firm concentration ratio (CRₙ). The dataset is historical and used here purely to visualise how CRₙ is read from market-share charts. Source
The result is expressed as a percentage of total industry sales or output.
Importance in Market Structure Analysis
Relation to Market Power
A monopoly would result in a CR1 of 100%, meaning one firm controls the entire market.
A perfectly competitive market would produce very low concentration ratios, as no single firm holds significant market share.
An oligopoly is often associated with CR4 or CR5 above 60–70%.
Application in Economics
Concentration ratios are important for analysing:
Market dominance: Regulators use concentration ratios to identify anti-competitive structures.
Barriers to entry: High ratios suggest that dominant firms may be protected by barriers such as economies of scale.
Pricing power: A high concentration ratio implies firms may have greater influence over prices.
Advantages and Limitations
Advantages
Simplicity: Easy to calculate and interpret.
Comparability: Can compare across industries or over time.
Indicator of competition: Provides a quick snapshot of market dominance.
Limitations
Not comprehensive: Concentration ratios do not account for smaller firms’ competitiveness.
Static measure: They show current dominance but not future changes, such as potential new entrants.
Product differentiation ignored: Two markets with the same CR4 might differ significantly if firms produce highly differentiated goods.
Geographic scope: A high ratio nationally may hide strong local competition or vice versa.
Wider Context in AQA Syllabus
Students should understand that concentration ratios provide a quantitative tool for examining oligopolistic markets. They link directly to topics such as:
Collusive vs non-collusive oligopoly (5.5.4): High ratios may encourage collusion.
Price rigidity and interdependence (5.5.5): High ratios highlight inter-firm reliance.
Market contestability (5.9): High concentration may suggest reduced contestability unless entry barriers are low.
Key Takeaways for A-Level
Concentration ratios show the degree of market control held by the largest firms.
They are calculated by summing the market shares of the top firms.
High concentration indicates oligopolistic or monopolistic tendencies, while low concentration suggests competitive markets.
Though useful, concentration ratios should be complemented with other measures such as the Herfindahl-Hirschman Index (HHI), which gives greater weight to larger firms.
Higher values of CRn indicate a more concentrated industry and, other things equal, greater potential for oligopolistic behaviour.
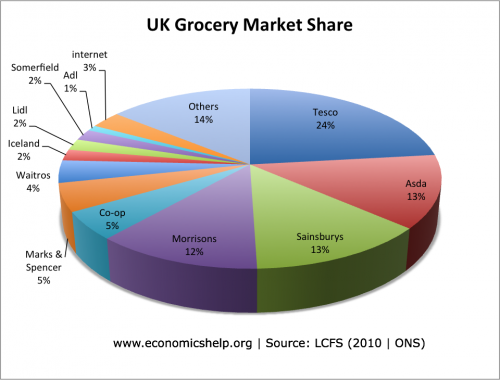
A market-share chart for the UK grocery sector with firms ordered by share. Adding the largest n firms’ percentages provides CRₙ for the industry. Minor contextual details (such as exact year or data source notes) extend beyond the syllabus but do not change how CRₙ is interpreted. Source
Practice Questions
Define a concentration ratio and explain briefly what a high CR4 value indicates about a market. (2 marks)
1 mark for correct definition: measure of the combined market share of the largest n firms.
1 mark for explanation: high CR4 suggests market dominance by a few firms / reduced competition / potential oligopolistic behaviour.
Using the concept of concentration ratios, discuss how regulators might use this measure to assess the competitiveness of an industry. (6 marks)
1 mark: Identification that regulators use concentration ratios to gauge market dominance.
1 mark: Explanation that higher concentration ratios suggest less competition and possible collusion/oligopoly behaviour.
1 mark: Reference to lower concentration ratios suggesting greater competition and limited market power.
1 mark: Acknowledgement that CR alone is limited (e.g., ignores product differentiation, contestability, or smaller firms’ influence).
1 mark: Recognition that regulators may use CR alongside other measures (e.g., Herfindahl-Hirschman Index, barriers to entry, profitability).
1 mark: Clear evaluative comment about the usefulness and limitations of CR in real-world decision-making.
FAQ
A CR4 looks at the combined market share of the top four firms, while a CR10 considers the top ten.
Economists may choose CR4 when analysing highly concentrated industries such as energy or banking, as it highlights the power of just a few firms. CR10 is more appropriate in markets where dominance is spread across more companies, such as retail, to capture a fuller picture of competition.
Concentration ratios focus only on the largest firms and may miss smaller competitors exerting pressure on prices or innovation.
They also do not consider potential entrants or the effects of global competition. For example, an industry may appear concentrated nationally, but international imports may keep domestic firms competitive.
Regulators do not use a single universal threshold but apply guidelines.
A CR4 above around 60% may raise concern in many industries.
Context matters: in natural monopolies, high ratios are expected, while in retail, they may be more problematic.
Regulators often combine CR analysis with evidence on pricing behaviour, barriers to entry, and consumer choice.
Yes, shifts can happen rapidly due to mergers, acquisitions, or technological change.
For example, a large merger instantly raises the CR4, while disruptive innovation (such as a new digital platform) can lower concentration by increasing competition.
Short-term shocks, such as a major firm exiting the market, can also change ratios significantly.
Concentration ratios measure the combined share of the largest n firms, ignoring how unequal their sizes are.
The HHI, by squaring each firm’s market share and summing them, gives more weight to larger firms and provides a finer measure of dominance.
While CR is easier to calculate, the HHI offers greater precision for regulators when assessing market power.
