
AQA Specification focus:
‘The kinked demand curve model. The kinked demand curve model should be used as an illustration of the interdependence between firms and not taught as if it is the only model of oligopoly.’
Introduction
The kinked demand curve model helps explain why prices in oligopolistic markets often remain stable despite changing costs or demand conditions, highlighting firm interdependence and strategic behaviour.
Oligopoly and Price Rigidity
Oligopolistic markets are characterised by a small number of large firms, each with significant market share. Because firms are interdependent, decisions about pricing and output must take competitors’ likely reactions into account. One of the main puzzles in oligopoly is price rigidity — prices tend to remain stable over time, even when costs or demand change.
The Kinked Demand Curve Model: Overview
The kinked demand curve was introduced by economist Paul Sweezy as a way of explaining price stability in oligopolistic markets. The model suggests that firms believe rivals will react differently to price increases than to price cuts.
If a firm raises its price, rivals are unlikely to follow, causing the firm to lose market share.
If a firm lowers its price, rivals are likely to match the cut, preventing it from gaining market share but reducing industry profits.
This asymmetry in rival behaviour leads to a kinked demand curve, which in turn generates a discontinuous marginal revenue curve.
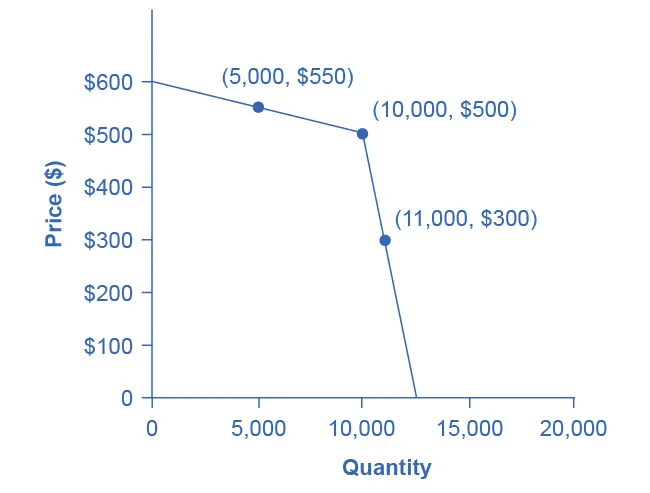
Figure 10.5 illustrates a kink at the prevailing price/quantity with annotated points for price rises and price cuts when rivals do or do not follow. The diagram emphasises interdependence and why firms expect stable prices around the kink. Note: this figure abstracts from MR/MC to focus on the behavioural construction of the kink. Source
Kinked Demand Curve: A demand curve in oligopoly theory which is more elastic for price increases than for price decreases, due to asymmetric rival responses.
The kink occurs at the prevailing market price, where firms believe they face:
Elastic demand for price rises (consumers switch away).
Inelastic demand for price cuts (rivals match cuts, limiting sales gains).
Diagrammatic Analysis
The kinked demand curve can be illustrated with two segments:
Above the kink: demand is relatively elastic, as consumers are sensitive to price increases and rivals do not follow.
Below the kink: demand is relatively inelastic, as rivals follow price decreases and sales gains are limited.
This creates a discontinuous marginal revenue (MR) curve, with a vertical gap at the kink.
Price Rigidity Implication
Because of the vertical MR gap, changes in marginal cost (MC) within this range do not alter the profit-maximising price or output. This explains why prices in oligopolistic markets are often sticky — firms have little incentive to change them even if costs fluctuate.
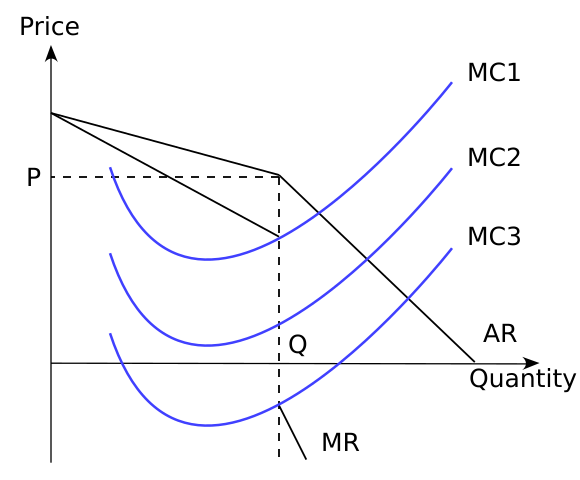
Kinked demand with a discontinuous marginal revenue curve and a range of marginal cost schedules (MC1–MC3). Within the MR gap, shifts in MC leave the profit-maximising price and output unchanged, illustrating price rigidity in oligopoly. This diagram focuses on the interdependence logic behind sticky prices in non-collusive settings. Source
Interdependence and Strategic Behaviour
The AQA specification emphasises that this model should be seen as an illustration of interdependence. Oligopolists must always consider how competitors react, and this interdependence shapes pricing behaviour.
Price increases → rivals ignore → loss of customers.
Price decreases → rivals match → no sales gain, reduced profits.
Stable prices → firms avoid destructive price wars.
Price Rigidity: A situation in which prices remain stable in a market, even when costs or demand change, often due to strategic interdependence among firms.
The kinked demand curve is therefore useful in understanding why price wars are rare in oligopolistic industries, and why firms prefer non-price competition such as advertising, branding, and innovation.
Criticisms of the Model
While the kinked demand curve provides insights into price rigidity, economists have criticised it for several reasons:
It does not explain how the initial price and output are determined.
It assumes rivals always react asymmetrically (follow cuts but not rises), which may not always be true.
It ignores other models of oligopoly behaviour, such as collusion, game theory, and price leadership.
Despite these limitations, the model remains a valuable teaching tool for illustrating interdependence and the persistence of stable prices in oligopoly.
Real-World Relevance
Although the kinked demand curve is not a comprehensive theory, it can be linked to markets where firms demonstrate price rigidity, such as:
Petrol retailers (where prices remain stable despite changing oil costs).
Supermarkets (where promotions focus on non-price strategies like loyalty schemes rather than frequent price cuts).
Mobile phone networks (where firms rely on contracts and service differentiation).
These examples demonstrate how the model captures key aspects of oligopolistic behaviour without being the only explanation.
Key Takeaways for AQA Students
The kinked demand curve highlights how interdependence shapes firm behaviour in oligopoly.
It provides a theoretical explanation for price rigidity in markets where firms are reluctant to change prices.
The model must be understood as one illustration, not the definitive account of oligopoly behaviour.
The MR discontinuity means cost changes may not affect price or output.
While useful, the model has limitations and should be considered alongside alternative theories.
Practice Questions
Explain why the kinked demand curve leads to price rigidity in oligopolistic markets. (2 marks)
1 mark for recognising that demand is more elastic for price rises and more inelastic for price cuts.
1 mark for stating that this creates a discontinuous MR curve, meaning changes in marginal cost within this range do not affect price/output.
Using the kinked demand curve model, analyse why firms in oligopolistic markets may prefer non-price competition to price changes. (6 marks)
1–2 marks: Knowledge of the kinked demand curve (asymmetric rival responses, elastic above the kink, inelastic below).
1–2 marks: Application to price rigidity (changes in MC may not alter P or Q; price wars unlikely).
1–2 marks: Analysis of why firms shift to non-price competition (branding, advertising, service quality) as a way to gain market share without destabilising prices.
Maximum 6 marks.
FAQ
The kinked demand curve suggests that rivals will quickly match any price cut, making it difficult for a firm to gain additional sales. This means that price wars reduce profits for all firms without generating significant market share benefits.
Instead, firms avoid aggressive pricing and keep prices stable. This behaviour reflects their awareness of interdependence in oligopolistic markets.
Consumer responsiveness shapes the kink.
When prices rise above the kink, demand is elastic, as consumers switch to competitors offering lower prices.
When prices fall below the kink, demand is inelastic, because competitors match the cut and consumers see little gain in switching.
This behaviour reinforces the expectation of price stability.
The kink in demand creates two distinct slopes: one elastic and one inelastic.
When marginal revenue is derived from this demand curve, the change in slope at the kink leads to a vertical gap in the MR curve.
This discontinuity is crucial because it allows changes in marginal cost within this gap without altering the equilibrium price or output.
The model is often applied to industries with:
A few dominant firms.
Similar products with little differentiation.
High visibility of competitors’ pricing strategies.
Examples include petrol retailing, supermarkets, and mobile phone contracts. These industries display the price stability and interdependence that the kinked demand curve is designed to illustrate.
Because prices remain rigid under the kinked demand curve, firms compete in other ways.
Non-price competition may include:
Heavy advertising and branding.
Product quality improvements.
Customer service enhancements.
These strategies allow firms to increase market share without destabilising prices, making them a logical outcome of the kinked demand curve model.
