
AQA Specification focus:
‘Some knowledge of the distribution of household income and wealth in the United Kingdom is expected.’
Understanding the distribution of income and wealth in the United Kingdom is essential for analysing economic inequality, identifying long-term trends, and assessing their implications for individuals and society.
Income and Wealth in the UK
Income
Income refers to the flow of money received by individuals or households over a period of time, typically from wages, salaries, pensions, benefits, or investments. Income inequality in the UK has fluctuated over the decades, influenced by labour market changes, government policies, and broader economic conditions.
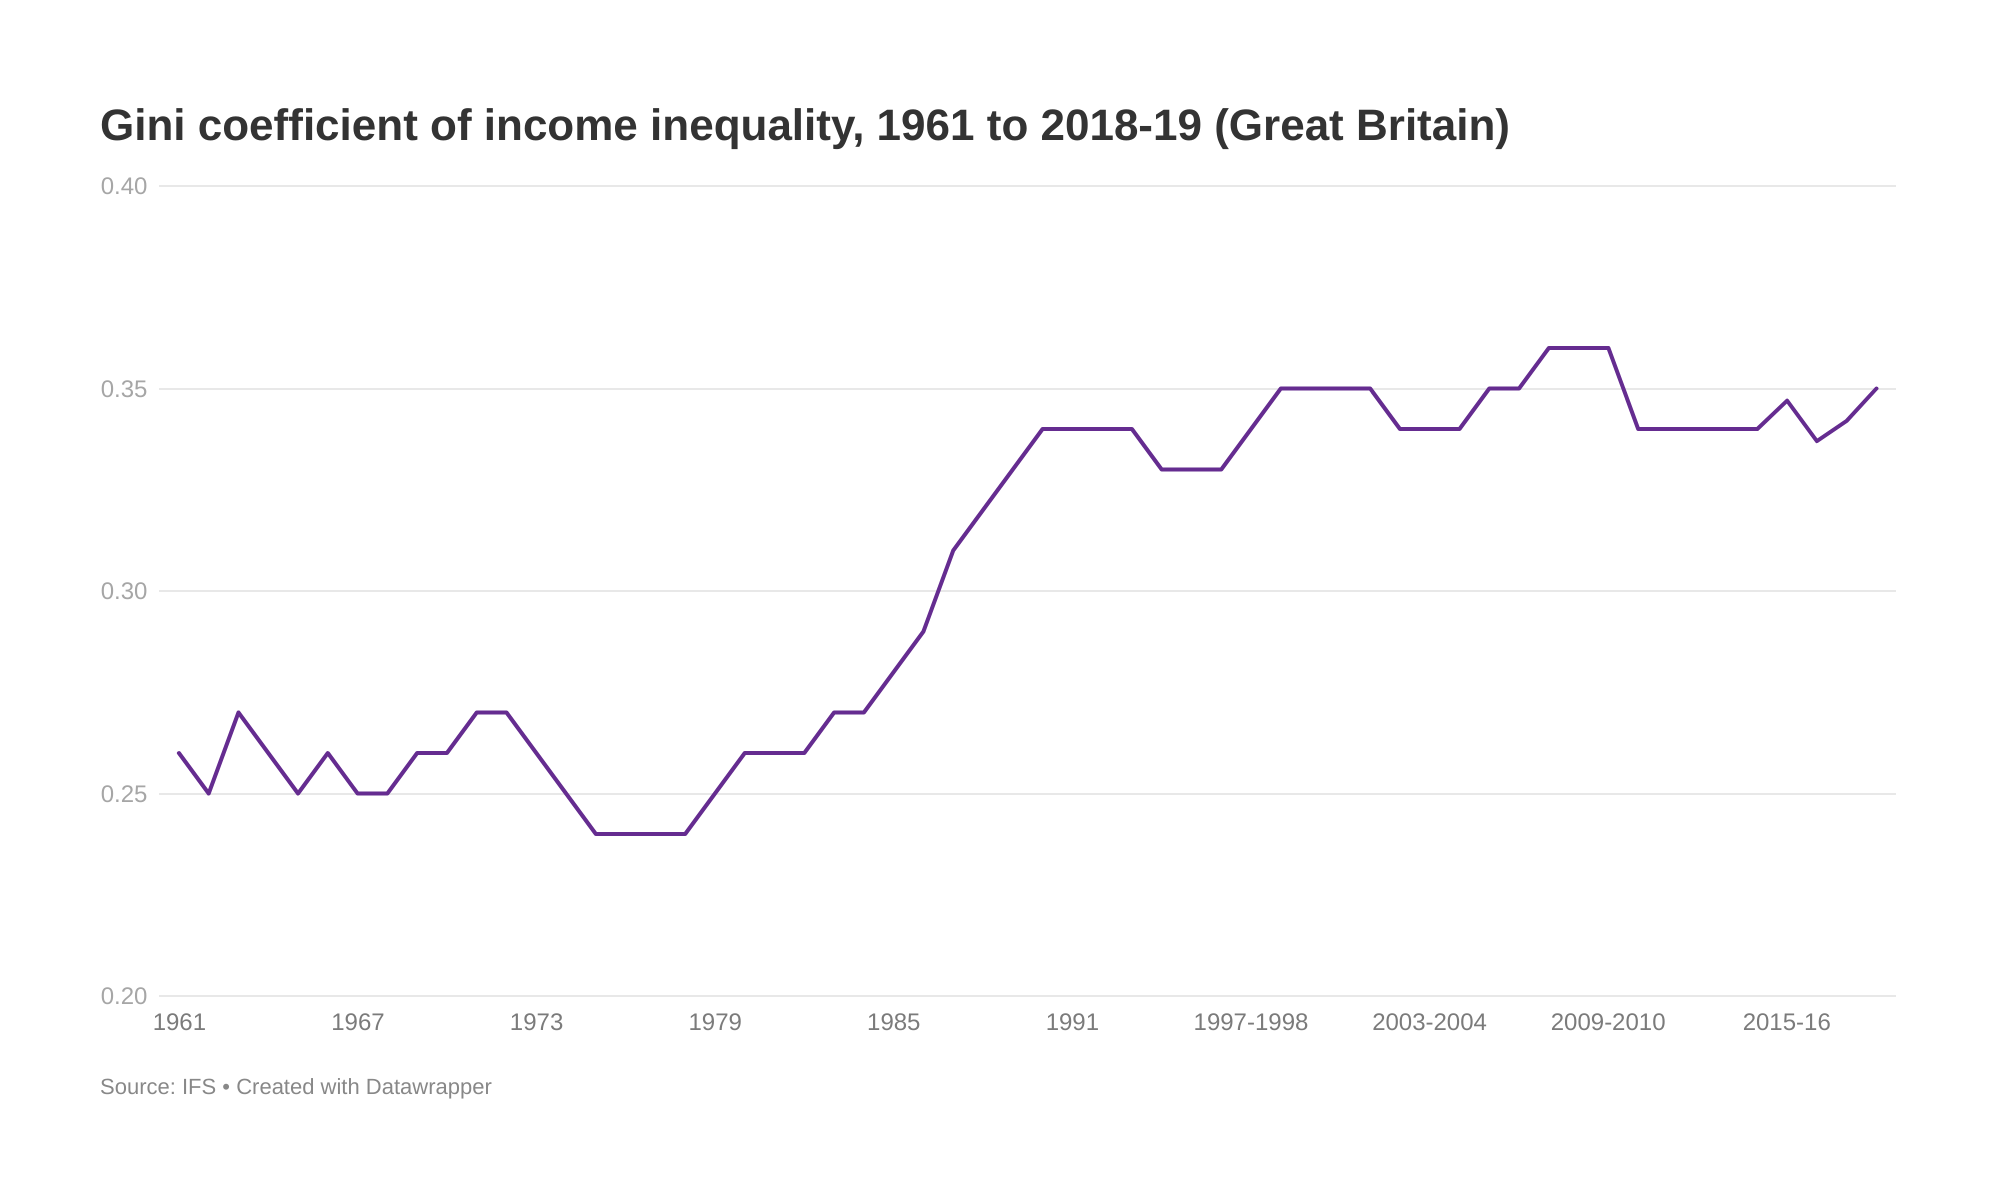
The graph depicts the Gini coefficient for income inequality in the UK from 1961 to 2019. A higher Gini coefficient indicates greater income inequality, with a sharp rise during the 1980s. Source
Wealth
Wealth is the stock of assets owned by individuals or households at a particular point in time, including property, savings, investments, and pensions. Wealth distribution in the UK is more unequal than income distribution because wealth accumulates over time and is often passed on between generations.
Wealth Inequality: The unequal distribution of assets (such as housing, pensions, and financial investments) across individuals or households within an economy.
While income inequality shapes short-term living standards, wealth inequality has deeper long-term effects, especially on social mobility and opportunities.
Current Distribution of Income
Household Income Distribution
The distribution of household income in the UK demonstrates persistent inequality, although with some stabilisation since the early 2000s. According to household survey data, the top 20% of households consistently receive over 40% of total income, while the bottom 20% receive less than 10%.
Key influences on income distribution include:
Labour market outcomes: Skill levels, education, and technological change impact wage differentials.
Employment status: Full-time, part-time, and self-employed individuals experience differing income stability.
Government transfers: Welfare benefits and tax credits reduce inequality, but changes in policy can widen or narrow gaps.
Taxation: Progressive taxation redistributes income but has varied effectiveness depending on political priorities.
Trends in Income Inequality
Income inequality rose significantly in the 1980s due to labour market reforms, globalisation, and a decline in traditional manufacturing jobs. Since then, inequality has remained relatively high compared to post-war levels but has not widened substantially further.
Notable recent trends include:
Growth in high-paid service sector jobs leading to a widening gap between skilled and unskilled workers.
Increasing income share of the top 1%, especially in finance and business sectors.
Slow income growth for middle-income households since the 2008 financial crisis.
Rising in-work poverty, as many low-income households remain below poverty thresholds despite employment.
Current Distribution of Wealth
Wealth Concentration
Wealth in the UK is heavily concentrated at the top. The wealthiest 10% of households hold around 40–45% of total wealth, while the poorest 50% own less than 10%. This highlights stark inequality between different groups.
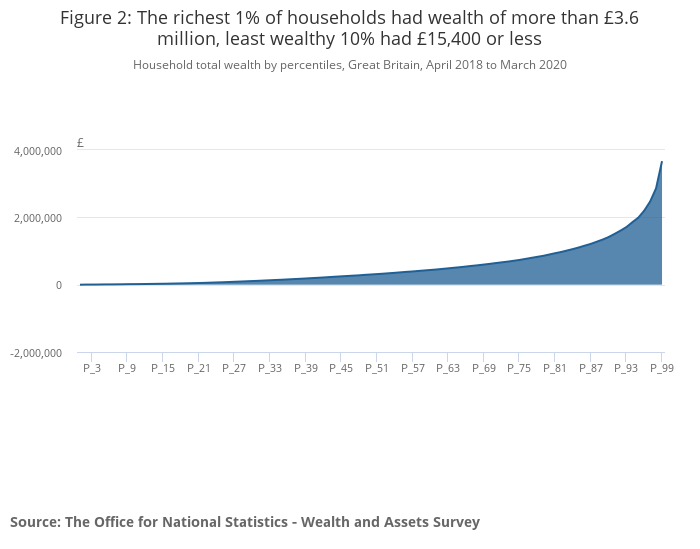
The chart shows household total wealth in Great Britain divided by decile. It highlights the concentration of wealth among the top deciles, with the wealthiest 10% holding a disproportionately large share. Source
Types of Wealth
Wealth inequality reflects the composition of assets:
Property wealth: Unequal house price growth across regions deepens divides, with London and the South East seeing far greater gains than other areas.
Pension wealth: Older generations typically hold substantial pension assets, creating intergenerational disparities.
Financial wealth: Stocks, shares, and savings are concentrated among high-income households, magnifying inequality.
Intergenerational Inequality: Economic disparities passed down between generations, often reinforced through wealth transfers such as inheritance and gifts.
Wealth distribution is therefore shaped not only by individual effort but also by structural factors like housing markets, inheritance, and pension systems.
Regional and Demographic Patterns
Regional Variations
The UK exhibits pronounced regional inequality in income and wealth:
London and the South East report higher average incomes and wealth, partly due to higher-paying industries.
Northern England, Wales, and some rural areas face lower incomes and limited wealth accumulation.
Regional disparities are further reinforced by housing market dynamics.
Age and Generational Differences
Older households generally possess more wealth due to accumulated assets and pensions.
Younger households struggle with housing affordability, student debt, and insecure employment, limiting their ability to build wealth.
Millennials and Generation Z face greater barriers to social mobility compared to earlier generations.
Gender and Ethnicity Dimensions
Women, on average, hold less wealth and earn less income than men, reflecting structural labour market inequalities.
Ethnic minority households often face additional barriers in wealth accumulation, with lower average property ownership and savings.
Long-Term Trends in Distribution
Historical Shifts
Post-war period (1945–1970s): Distribution became more equal due to strong trade unions, progressive taxation, and welfare expansion.
1980s: Inequality widened sharply due to deregulation, reduced welfare, and industrial restructuring.
2000s onwards: Inequality stabilised but remained historically high, with financialisation increasing the income and wealth of the top households.
Recent Developments
Post-2008 financial crisis: Real wage stagnation for middle and lower households.
COVID-19 pandemic: Short-term government support cushioned income inequality, but wealth inequality widened due to rising asset prices.
Current landscape: The income distribution is moderately unequal, but the wealth distribution remains highly skewed.
Key Trends to Recognise
Students should note the following patterns when considering the UK distribution of income and wealth:
Income inequality has remained broadly stable in recent decades but at a higher level than in the mid-20th century.
Wealth inequality is greater than income inequality and continues to widen, driven by housing markets and inheritance.
Regional, generational, gender, and ethnic differences play a significant role in shaping the distribution landscape.
Value judgements influence whether this distribution is considered fair or equitable, but the measurable trends remain essential for economic analysis.
Practice Questions
Define wealth inequality and explain how it differs from income inequality. (2 marks)
1 mark for a correct definition of wealth inequality (e.g., unequal distribution of assets such as property, pensions, and savings).
1 mark for explaining the difference from income inequality (e.g., income is a flow of money over time, while wealth is a stock of accumulated assets at a point in time).
Using examples, explain two key trends in the distribution of income and wealth in the UK. (6 marks)
Up to 3 marks for identifying and explaining one trend (e.g., income inequality rose in the 1980s but has since stabilised at a high level; wealth inequality is greater than income inequality and continues to widen).
Up to 3 marks for identifying and explaining a second trend (e.g., regional disparities between London/South East and other areas; generational inequality where older households hold more wealth; growth in wealth concentration due to rising house prices).
Maximum of 6 marks: students must clearly identify two distinct trends and provide some explanation or example for each.
FAQ
Wealth distribution has a significant impact on social mobility because assets such as property and financial investments are often passed down between generations.
Children from wealthier families benefit from inheritance, financial support for education, and housing advantages, making it easier to maintain or improve economic position.
By contrast, households without accumulated wealth face barriers to upward mobility, particularly in areas like housing affordability and access to quality education.
Wealth inequality is more pronounced because wealth accumulates over time and can be transferred across generations.
Key reasons include:
Housing markets, where property prices rise faster than incomes.
Investment returns, which primarily benefit those with existing wealth.
Pension assets, concentrated among older generations.
This means small differences in income can grow into large disparities in wealth.
Housing is the largest component of household wealth in the UK, and unequal regional price growth widens wealth gaps.
London and the South East have seen rapid house price increases, boosting household wealth in those regions. In contrast, stagnant or slower growth in other regions has left many households without the same opportunity to build wealth.
As a result, property ownership strongly determines household wealth, creating a divide between homeowners and renters.
The financial crisis led to slow or stagnant income growth for many households, particularly those on middle and lower incomes.
Meanwhile, asset prices, including housing and financial markets, recovered strongly, benefitting wealthier households.
This caused income inequality to remain broadly stable, but wealth inequality to widen, as those with assets saw significant gains compared to those without.
Wealth inequality is influenced by differences across age, gender, and ethnicity.
Age: Older households hold more wealth due to accumulated pensions and property.
Gender: Women often earn less over their lifetimes, leading to lower pension savings and wealth accumulation.
Ethnicity: Minority households are less likely to own property or hold high-value assets, reducing opportunities for wealth growth.
These demographic divides compound structural inequality in the UK.
