
AP Syllabus focus: ‘Unemployment and participation rates are calculated using labor force and population data.’
Labor market indicators summarize how many people are working or seeking work relative to the population. AP Macroeconomics expects you to compute the key rates correctly from basic counts and interpret what changes in those counts imply.
Core counts you must identify first
Accurate calculation depends on sorting people into the right categories before applying formulas.
Labor force: The number of people who are employed plus the number of people who are unemployed (actively seeking work).
Use these counts (typically from a labor force survey):
Employed (E): People with a job during the reference period (including many part-time workers).
Unemployed (U): People without a job who are available for work and have actively searched recently.
Not in the labor force (NILF): Everyone else (neither working nor actively searching).
Adult population (P): The relevant population base used for participation calculations (as defined by the data source).
A key identity ties the categories together:
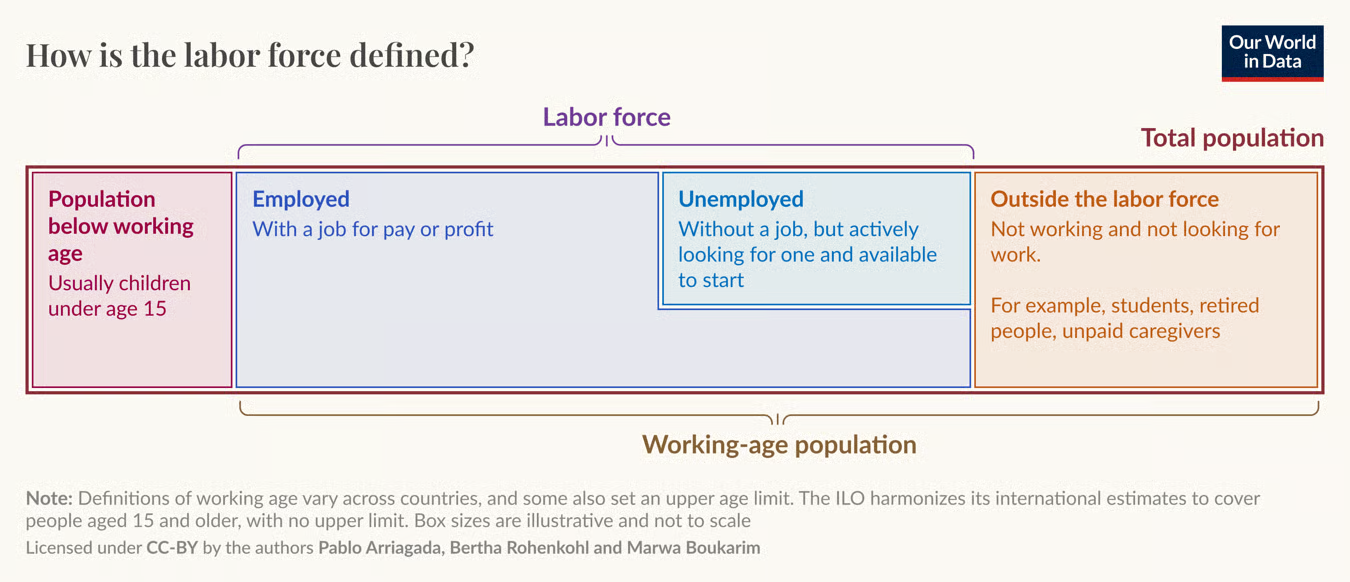
This diagram breaks the population into mutually exclusive labor-force-status groups (employed, unemployed, and outside/not in the labor force). It reinforces the idea that rate calculations depend on correctly classifying people into , , and NILF before applying any formulas. The visual grouping helps prevent the common mistake of treating “not in the labor force” as unemployed. Source
Labor force (LF) is
Key labor market indicators to calculate
The syllabus focus is that unemployment and participation rates are calculated using labor force and population data. These two rates share inputs but answer different questions.
Unemployment rate (UR)
The unemployment rate measures unemployment as a share of the labor force (not the total population).
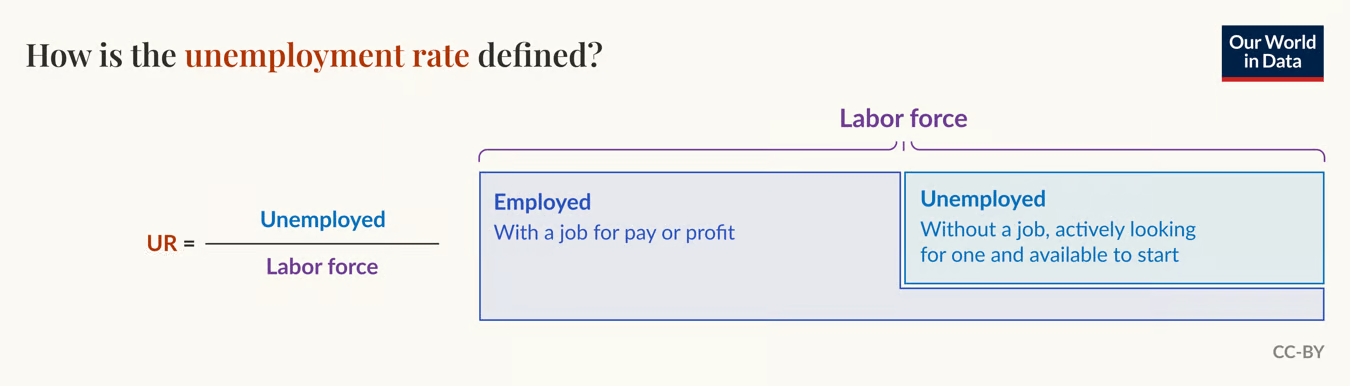
This figure illustrates the unemployment rate as a ratio: . By showing “Unemployed” as a subset of the “Labor force,” it clarifies why NILF is excluded from the denominator. The labeling also reinforces the AP distinction between being jobless and being unemployed (actively searching). Source
Unemployment rate: The percentage of the labor force that is unemployed.
= unemployment rate (percent)
= number unemployed (people)
= labor force (people)
Because excludes people not actively searching, the unemployment rate can change even when employment does not, if people enter or exit the labor force.
Labor force participation rate (LFPR)
The participation rate measures engagement with the labor market: working or actively seeking work as a share of the population.
Labor force participation rate: The percentage of the adult population that is in the labor force.
= labor force participation rate (percent)
= labor force (people)
= adult population (people)
A rising LFPR means a larger share of the population is either employed or actively looking, while a falling LFPR means a larger share is classified as NILF.
Practical calculation steps (AP-ready)
Use a consistent order to avoid denominator mistakes:
Step 1: Confirm the given counts correspond to E, U, and P (and whether LF is already provided).
Step 2: If needed, compute LF = E + U.
Step 3: Compute UR using U over LF, then multiply by 100.
Step 4: Compute LFPR using LF over P, then multiply by 100.
Step 5: Check reasonableness:
UR must be between 0 and 100, and it uses LF (not P) in the denominator.
LFPR must be between 0 and 100, and LF cannot exceed P.
Practice Questions
(2 marks) An economy has 160 million employed people and 10 million unemployed people. Calculate the unemployment rate. Give your answer to one decimal place.
Identifies labour force as million (1)
Calculates (1)
(5 marks) The adult population is 260 million. There are 190 million employed and 15 million unemployed. (a) Calculate the labour force. (1 mark) (b) Calculate the labour force participation rate. (2 marks) (c) Calculate the unemployment rate. (2 marks)
million (1) (b)
Uses (1)
(1) (c)
Uses (1)
(1)
FAQ
The unemployment rate is designed to measure joblessness among people who are participating in the labour market.
Using the total population would mix in people who are not seeking work, which would blur what the statistic is intended to capture.
They are typically counted once as employed.
Employment counts are person-based, not job-based, so multiple jobholders do not increase $E$ beyond one person.
They usually move from $U$ to “not in the labour force,” reducing both $U$ and $LF$.
Depending on magnitudes, $UR=\dfrac{U}{LF}\times 100$ can fall even though no one found a job.
Differences in:
retirement ages and demographics
education enrolment rates
cultural norms around work
childcare access and family policies
can change $LF$ relative to $P$ without implying the same change in $UR$.
Many published series are seasonally adjusted to remove predictable patterns (e.g., holiday hiring, school schedules).
Seasonal adjustment helps comparisons across months reflect underlying changes rather than regular seasonal swings.
