
AP Syllabus focus: ‘The unemployment rate may understate joblessness by excluding discouraged and underemployed workers.’
Unemployment statistics are essential for judging economic performance, but the headline rate can misrepresent actual labor market conditions.
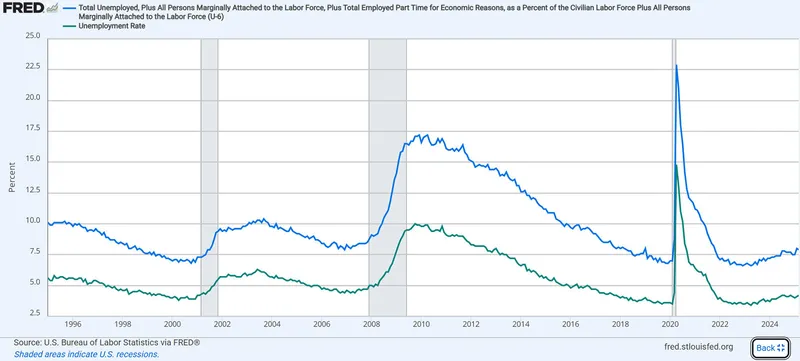
This chart compares the official unemployment rate (U-3) with the broader U-6 measure, which adds marginally attached workers and people working part-time for economic reasons. The persistent gap between the lines visualizes “hidden slack” that does not show up in the headline rate, especially around and after recessions. Shaded recession bars emphasize that broader underutilization can remain elevated even as U-3 falls. Source
Understanding what is omitted—or counted in misleading ways—helps interpret reported unemployment responsibly.
What the Unemployment Rate Misses
Discouraged workers (not counted as unemployed)
A major limitation is that some jobless people are excluded from the labor force, so they are not counted as unemployed even though they want work.
Discouraged worker: A person who wants a job, is available to work, but has stopped searching because they believe no jobs are available for them.
Because discouraged workers are classified as not in the labor force, an economy can have substantial hidden joblessness while the official unemployment rate looks lower than lived experience suggests. This is especially important after long recessions, when unsuccessful job searches can reduce search activity.
Underemployment (counted as employed, but still “slack”)
The official unemployment rate does not capture many people who have a job but are not using their labor fully.
Underemployed worker: An employed person whose labor is not fully utilised, such as someone working part-time who wants full-time hours or working in a job well below their skill level.
Underemployment matters because it signals unused productive capacity in the labor market.
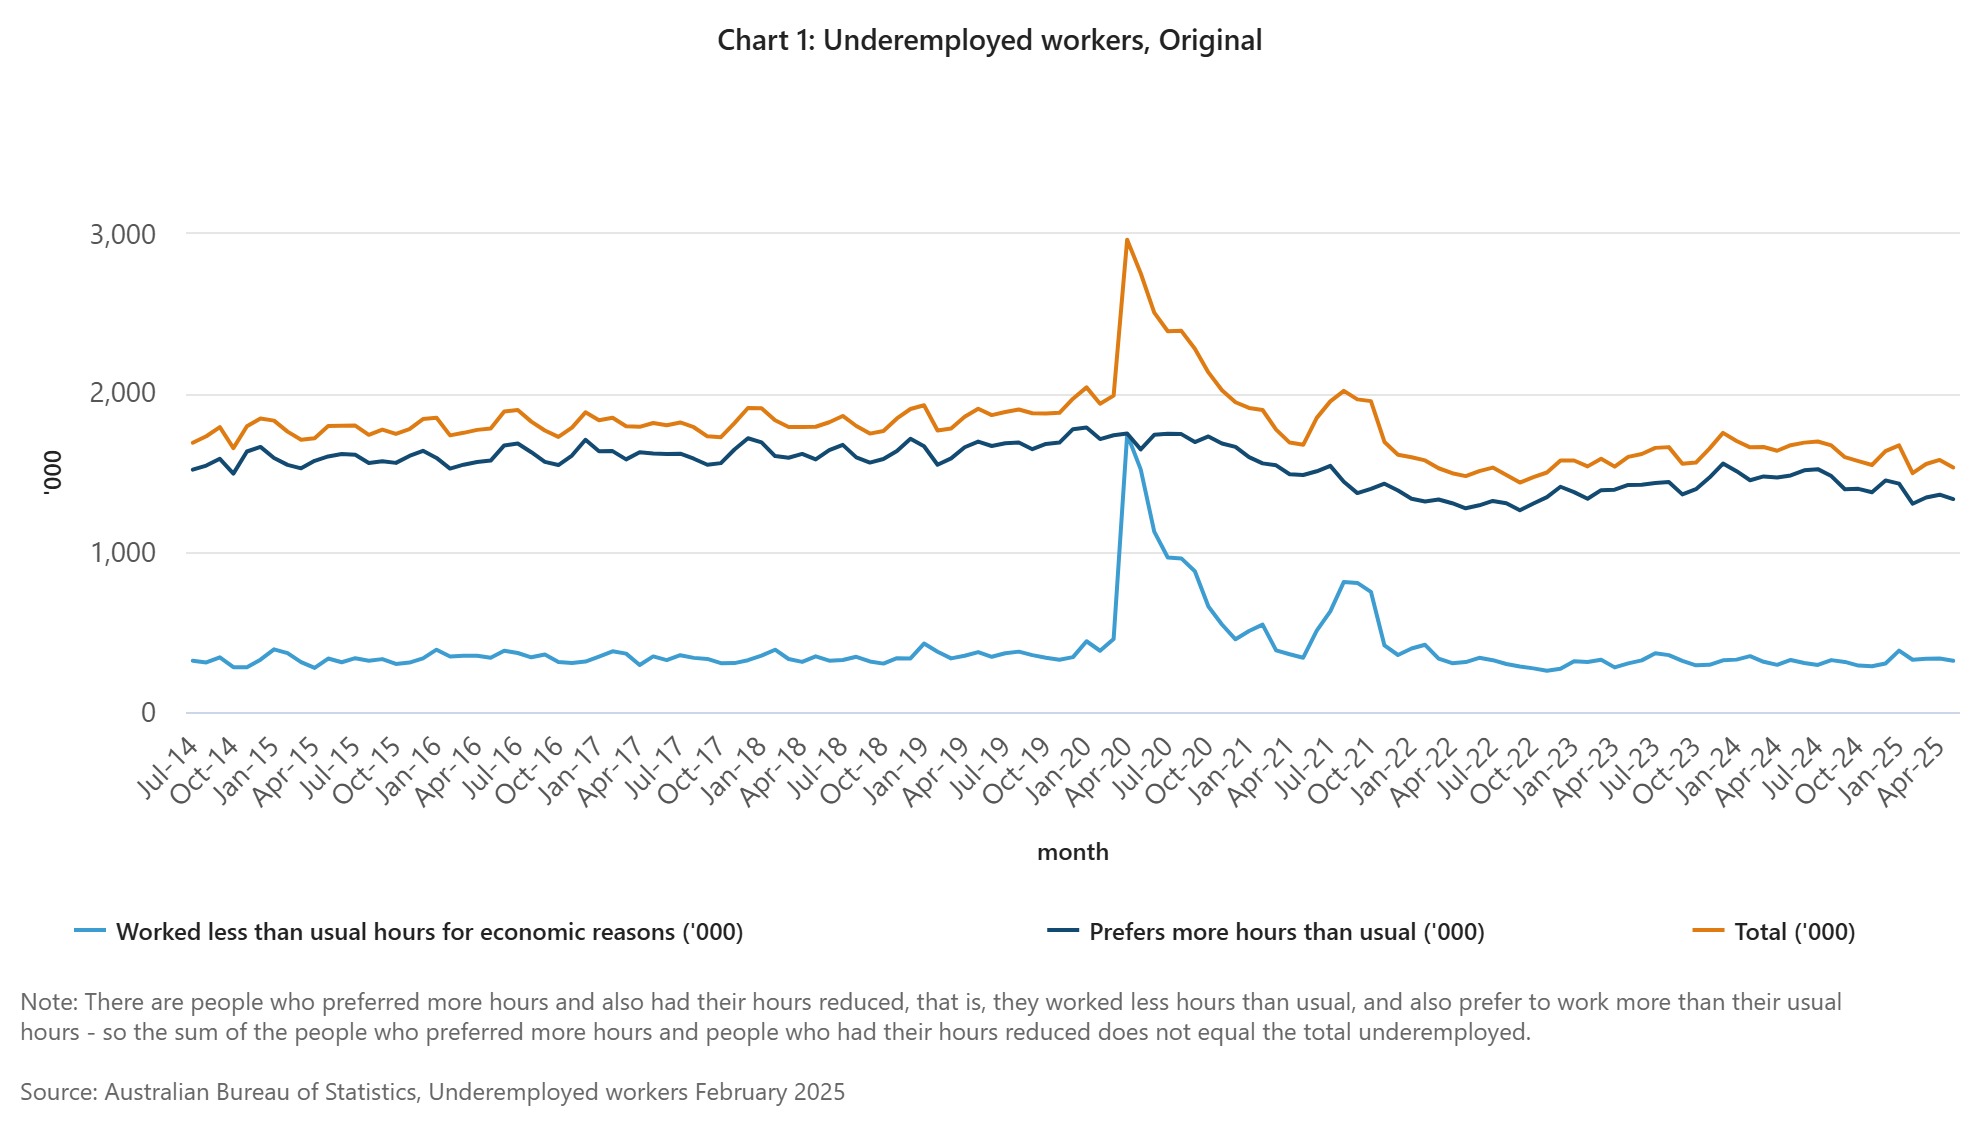
This diagram breaks “underemployment” into clearly labeled components, separating reduced-hours-for-economic-reasons (cyclical underemployment) from workers who prefer more hours (structural underemployment). It also shows how narrower headline underemployment can be expanded by adding additional groups, reinforcing why employment status alone can hide labor-market slack. The flowchart format mirrors how statistical agencies construct labor underutilization measures from underlying categories. Source
In particular, involuntary part-time workers are counted as employed, so a rise in part-time-for-economic-reasons can make conditions look stronger than they are if you only track unemployment.
Measurement and Classification Problems
Boundary issues: “employed” vs “unemployed” vs “not in the labor force”
Official statistics rely on strict categories that can misclassify real situations:
If someone wants work but has not searched recently, they may be excluded from unemployment.
People doing a small amount of paid work during the reference period are typically counted as employed, even if earnings or hours are minimal.
Students, caregivers, and early retirees may want jobs under the right conditions, but many are not counted as unemployed.
These boundaries can shift without any real improvement in job availability. For example, a falling unemployment rate could reflect people leaving measured job search rather than finding work.
Data collection limits (survey-based error)
Unemployment figures usually come from household surveys, not a complete count of every worker. This can introduce:
Sampling error: estimates differ from the true population value.
Response error: people misunderstand questions or report inconsistently.
Timing issues: a one-week reference window may miss short spells of joblessness or unstable hours.
As a result, month-to-month changes can sometimes reflect statistical noise rather than genuine labor market change.
Job quality and intensity are largely invisible
The unemployment rate is a narrow indicator of joblessness, not job quality. It does not directly reflect:
reduced hours, reduced overtime, or unpredictable scheduling
low wages relative to cost of living
temporary, seasonal, or insecure work arrangements
Two economies can have the same unemployment rate but very different levels of economic hardship if one has widespread low-hour or low-quality employment.
How to Interpret Unemployment Data More Carefully
To account for these limitations, interpret the headline rate alongside broader signs of labor market slack, focusing on:
changes in the number of people not in the labor force who still want work
trends in part-time for economic reasons and other underemployment signals
persistence of joblessness (whether people remain without work for long periods)
Even when the unemployment rate falls, rising discouragement or underemployment can mean the economy is still operating below its potential in terms of labor utilization.
Practice Questions
(3 marks) Explain how excluding discouraged workers can cause the official unemployment rate to understate joblessness.
1 mark: Identifies that discouraged workers are not counted as unemployed.
1 mark: Explains they are classified as not in the labour force due to not actively searching.
1 mark: Links exclusion to a lower measured unemployment rate than true joblessness.
(6 marks) Using unemployment data limitations, explain two reasons why the headline unemployment rate may not reflect true labour market slack.
1 mark: Identifies discouraged workers as excluded.
1 mark: Explains why discouraged workers are excluded (no recent active search).
1 mark: Links exclusion to understatement of slack/joblessness.
1 mark: Identifies underemployment (e.g., involuntary part-time) as not captured by unemployment.
1 mark: Explains underemployed workers are counted as employed despite wanting more hours/appropriate work.
1 mark: Links underemployment to hidden slack despite a stable/falling unemployment rate.
FAQ
U-6 is broader because it includes additional groups beyond the headline measure, such as discouraged and other marginally attached workers, plus those working part-time for economic reasons.
It can rise even when the headline rate falls, highlighting hidden slack.
Employment status is typically based on whether someone did any paid work in the reference period.
That rule is designed for consistency, but it means the statistic tracks jobholding, not desired hours.
Seasonal adjustment removes predictable calendar patterns (e.g., school schedules, holidays).
It can change the month-to-month movement, so analysts often compare both seasonally adjusted trends and longer-run averages.
People with sporadic gigs may report being employed despite very low hours or unstable income.
Others may stop seeking traditional jobs while still wanting more work, blurring the line between employment, underemployment, and nonparticipation.
Rapid changes can cause misclassification (for example, people absent from work or expecting recall).
Survey responses may not fit standard categories well, so the published rate may diverge from on-the-ground conditions.
