CIE Syllabus focus:
'Candidates should calculate liquidity ratios, including the current ratio and acid test ratio.'
Liquidity ratios measure a business’s ability to meet short-term obligations from short-term resources. At this level, the key calculations are the current ratio and the acid test ratio, both drawn from statement of financial position figures.
Understanding liquidity
In accounting, liquidity refers to short-term financial strength.
Liquidity: The ability of a business to meet short-term obligations as they fall due.
Liquidity ratios use figures from the statement of financial position at a particular date.
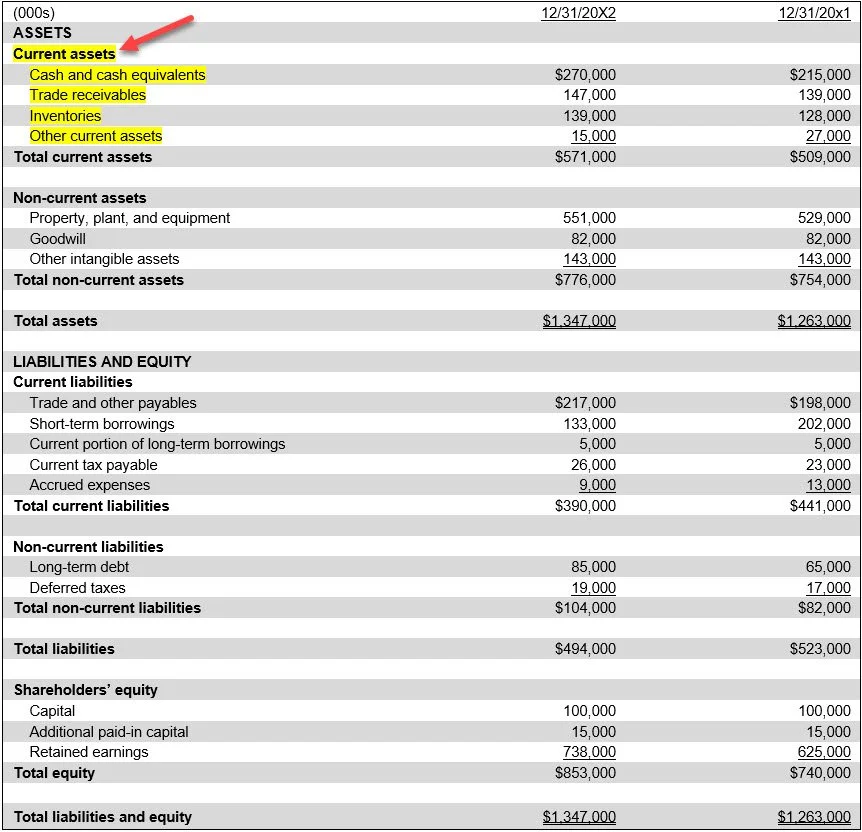
This example balance sheet highlights the current assets section and shows how it sits above non-current assets, making it easier to locate the figures needed for liquidity ratios. It also shows the current liabilities subsection under liabilities, reinforcing that both numerator and denominator come from the same statement/date. Source
They indicate whether the business appears able to pay amounts due in the near future using assets expected to turn into cash within one year. A business may report profit but still have weak liquidity if cash is tied up in inventory or in amounts owed by customers.
Current ratio
One of the main liquidity measures is the current ratio.

This diagram summarizes the current (working capital) ratio as a comparison of current assets to current liabilities. It helps you remember the structure before you plug in statement of financial position totals. Source
Current ratio: A ratio that compares total current assets with total current liabilities.
It compares total current assets with total current liabilities and is sometimes called the working capital ratio.
= assets expected to be realized, sold, used, or converted into cash within one year
= obligations due for payment within one year
Current assets normally include items such as inventory, trade receivables, cash at bank, cash in hand, and other short-term balances. Current liabilities normally include trade payables, accruals, short-term loans, tax payable, and bank overdrafts repayable in the short term.
The answer is usually presented as a ratio, such as . This means the business has two units of current assets for every one unit of current liabilities. A figure above shows current assets exceed current liabilities, while a figure below shows the opposite. The ratio is a measure of short-term cover, not proof that cash is available immediately.
Acid test ratio
Another important liquidity measure is the acid test ratio, also known as the quick ratio.

This diagram illustrates the quick (acid test) ratio by showing that you start with current assets and remove less-liquid items before dividing by current liabilities. It reinforces the key idea in the formula (and why excluding inventory makes the measure stricter). Source
Acid test ratio: A ratio that compares the more liquid current assets of a business with its current liabilities.
This ratio gives a stricter view of liquidity than the current ratio.
= total current assets taken from the statement of financial position
= goods held for resale or for use in production
= obligations due for payment within one year
Inventory is removed because it may not be sold quickly, and its sale value may not be realized immediately. As a result, the acid test ratio focuses more closely on assets that are nearer to cash, such as receivables and cash balances.
The acid test ratio is usually lower than the current ratio because the numerator is smaller once inventory has been excluded. If a business holds little inventory, the two ratios may be quite similar. The answer can be shown as a ratio such as .
Selecting the correct figures
To calculate either ratio correctly, use figures from the same date. Do not mix opening balances with closing balances, and do not combine figures from different statements.
If a question gives total current assets and current liabilities, substitute those totals directly into the formula. If separate items are given, identify whether each item is current or non-current before calculating.
For the acid test ratio, subtract inventory once only. If a question already provides quick assets or liquid assets, use that amount as the numerator without removing inventory again.
Amounts due after more than one year are not included in current liabilities, and non-current assets are never included in the liquidity ratio numerators.
Presenting answers clearly
In examination answers, clear presentation matters.
Good practice
write the correct formula first if space allows
show the figures used in the numerator and denominator
simplify the result to a ratio in the form
keep a sensible level of accuracy, often one or two decimal places
label the answer as current ratio or acid test ratio
A ratio on its own is not enough if the examiner cannot see which measure you have calculated.
Common mistakes
reversing the formula and dividing current liabilities by current assets
including non-current assets such as equipment or buildings
forgetting to exclude inventory from the acid test ratio
subtracting inventory when the question has already given quick assets
omitting short-term obligations from current liabilities
treating liquidity as exactly the same as cash in hand
These errors usually come from weak classification rather than difficult arithmetic.
Practice Questions
A business has current assets of 84000 and current liabilities of 56000.
Calculate the current ratio.
(2 marks)
Correct use of formula or correct substitution of figures: 1 mark
Correct answer of 1.5:1: 1 mark
The following balances relate to a business at the year end:
Inventory 22000
Trade receivables 36000
Cash at bank 8000
Trade payables 24000
Accruals 4000
Short-term loan 12000
Calculate: (a) the current ratio (2 marks)
(b) the acid test ratio (2 marks)
(c) state which ratio gives the stricter test of liquidity (1 mark)
(5 marks)
(a)
Current assets identified as 66000 and current liabilities identified as 40000: 1 mark
Correct current ratio of 1.65:1: 1 mark
(b)
Quick assets identified as 44000: 1 mark
Correct acid test ratio of 1.1:1: 1 mark
(c)
Acid test ratio: 1 mark
Reason is not required for the mark, but credit may be given if stated that inventory is excluded
FAQ
Yes. A very high current ratio can suggest that too much money is tied up in current assets rather than being used productively.
Possible reasons include:
idle cash balances
slow collection of receivables
excessive inventory levels
overcautious short-term financial management
A strong ratio is not automatically efficient.
Yes. A seasonal business may show a very strong or very weak ratio at the reporting date simply because of where that date falls in its trading cycle.
For a better view, users often compare:
several dates during the year
the same season in earlier years
expected cash needs in peak trading months
This helps avoid judging liquidity from an unrepresentative date.
Usually, yes, if it is repayable on demand or expected to be settled within one year.
However, if the overdraft is part of a longer-term financing arrangement and is classified differently in the financial statements, follow the classification given in the question.
In exams, the safest rule is to use the information exactly as presented.
The ratio shows only the total amount of current assets compared with current liabilities. It does not show the quality or speed of those assets.
For example:
one business may hold mostly cash
another may hold slow-paying receivables
another may hold inventory that is hard to sell
So the same current ratio can hide very different short-term positions.
Window dressing means taking short-term actions near the year end to make liquidity ratios look better than usual.
Examples include:
delaying payments to suppliers until after year end
collecting receivables aggressively just before the reporting date
postponing purchases to reduce current liabilities temporarily
These actions can improve the reported ratios for a short time, even if the underlying liquidity position has not truly improved.