CIE Syllabus focus:
'Candidates should calculate efficiency ratios, including non-current asset turnover, trade receivables turnover, payables turnover, inventory turnover and rate of turnover.'
Efficiency ratios show how effectively a business uses assets and working capital in day-to-day operations.
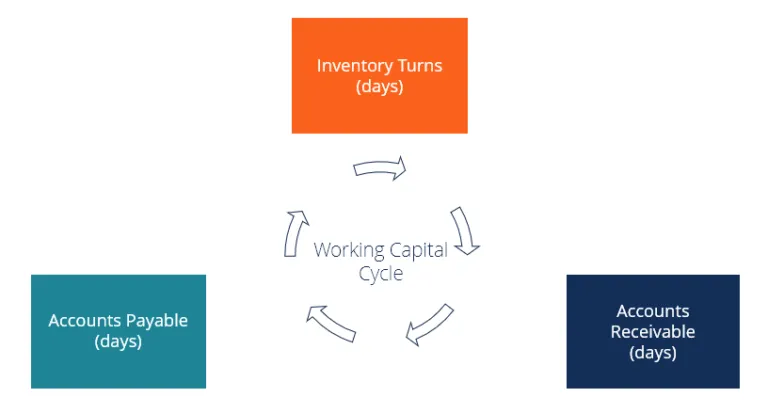
Working-capital efficiency can be visualised as a cycle connecting inventory held (inventory days), credit granted to customers (accounts receivable days), and credit received from suppliers (accounts payable days). The diagram helps you remember that these components are all time-based efficiency measures (in days) and they interact rather than being isolated calculations. Source
At this level, the key skill is selecting the correct figures and applying the correct formula and unit.
Understanding efficiency ratios
Efficiency ratios connect figures from the statement of profit or loss and the statement of financial position. They help measure how quickly a business turns resources into sales, collects from customers, pays suppliers, and moves inventory through the business.
Efficiency ratio: A ratio measuring how effectively a business uses its assets and working capital in routine operations.
In this topic, some answers are given in times, while others are given in days. This matters because a correct numerical answer with the wrong unit may lose marks.
When calculating any efficiency ratio, follow these rules:
use figures from the same accounting period
use trade receivables and trade payables, not total receivables or total payables unless the question clearly says so
use credit sales revenue and credit purchases where required
show the answer with the correct unit: times or days
use the figures provided in the question and do not replace them with estimates unless the data requires it
Non-current asset turnover
This ratio measures how much revenue is generated from the business’s investment in non-current assets. It is usually stated as a number of times.
= Revenue for the accounting period, in currency
= Net book value of non-current assets used by the business, in currency
The ratio links revenue to the net book value of non-current assets. It is important not to use cost of sales here, because the purpose is to compare asset use with sales generated. If a question gives only one non-current asset figure, use that figure. If a specific basis is stated, such as net book value, that basis must be followed.
Trade receivables turnover
This ratio measures the average number of days a business takes to collect amounts owed by credit customers. It is sometimes described as the collection period.
= Amount owed by credit customers at the period end, in currency
= Sales made on credit during the period, in currency
= Number of days in the year
Use trade receivables, not all receivables, because the ratio focuses only on credit customers. The sales figure should be credit sales revenue. If the question says all sales are on credit, total revenue can be used. The answer is given in days, not times.
Payables turnover
This ratio measures the average number of days a business takes to pay amounts owed to credit suppliers.
= Amount owed to credit suppliers at the period end, in currency
= Purchases made on credit during the period, in currency
= Number of days in the year
Only trade payables should be used. Other current liabilities, such as accruals or short-term loans, are not part of this calculation unless the question specifically includes them. The purchases figure should be credit purchases. If all purchases are on credit, the total purchases figure may be used.
Inventory turnover and rate of turnover
These two ratios are closely related, but they are not the same. Inventory turnover is usually expressed in days, while rate of turnover is expressed in times. Both use cost of sales, because inventory is consumed in generating cost of sales.
Average inventory: The mean inventory held during the period, usually found from opening inventory plus closing inventory divided by two.
Using average inventory gives a better measure when inventory levels change during the year.
= Average inventory held during the period, in currency
= Cost of goods sold during the period, in currency
= Number of days in the year
This ratio measures the average number of days inventory is held before being sold.
= Cost of goods sold during the period, in currency
= Average inventory held during the period, in currency
This shows how many times, on average, inventory is turned over during the year. Because the two ratios are related, they must use consistent figures. If average inventory is used for one, it should also be used for the other.
Presenting efficiency ratios accurately
In exam answers, method is important as well as the final figure. Good practice includes:
writing the formula before substituting numbers
keeping working clear and easy to follow
rounding sensibly, usually to one decimal place or to a whole number of days if appropriate
stating whether the answer is in days or times
checking that the numerator and denominator match the purpose of the ratio
A common source of error is using the wrong figure from the financial statements. For example, using revenue instead of credit sales revenue, or using total current liabilities instead of trade payables, will produce the wrong ratio even if the arithmetic is correct. Precision in selecting figures is therefore essential.
Practice Questions
A business has revenue of and non-current assets of .
Calculate the non-current asset turnover. [2]
Correct formula: [1]
Correct answer: times [1]
A business provides the following information for the year ended 31 December:
Credit sales revenue: Credit purchases: Cost of sales: Opening inventory: Closing inventory: Trade receivables: Trade payables:
Calculate: (a) trade receivables turnover [2] (b) payables turnover [2] (c) inventory turnover and rate of turnover [2]
(a)
Correct formula: [1]
Correct answer: days approximately [1]
(b)
Correct formula: [1]
Correct answer: days, or days approximately [1]
(c)
Average inventory: [1]
Correct answers:
days approximately
times [1]
FAQ
Average inventory reduces the effect of an unusually high or low closing inventory figure.
If a business buys a large amount of inventory just before the year end, closing inventory may overstate the stock normally held. Using an average gives a fairer basis for both inventory turnover and rate of turnover.
It is especially useful when:
inventory levels change seasonally
purchases are uneven through the year
the business holds large amounts of stock near year end
Read the wording carefully.
If the question says nothing about cash sales and gives only one sales figure, examiners sometimes expect you to use that figure. However, if the question clearly refers to credit customers or trade receivables, credit sales revenue is the ideal figure.
A safe approach is:
use the figure stated in the question
if all sales are on credit, use total sales
do not invent a credit sales figure that is not supported by the data
Yes.
A rate of turnover below $1$ means cost of sales for the year is less than average inventory. This suggests inventory is moving very slowly, or that the business is holding unusually high stock levels.
This can happen when:
goods are seasonal
the business is overstocked
sales are weak
inventory includes slow-moving or obsolete items
It is mathematically possible and should not be treated as an error.
Year-end balances may not represent normal trading conditions.
For example, a business may have very high December sales on credit, causing trade receivables at year end to be unusually large. This can make the receivables turnover period look longer than usual.
The same issue affects payables if large purchases are made near the reporting date.
In seasonal businesses, a single closing balance may not reflect the average position across the year.
Use the carrying amount shown in the question or financial statements.
If non-current assets have been revalued, the ratio will normally be based on the revalued carrying amount, because that is the figure currently reported in the accounts.
This matters because:
a higher asset value can reduce the ratio
the business may appear less efficient even if sales have not changed
comparisons across years can be affected by revaluations
Always follow the asset figure actually presented unless the question instructs otherwise.