CIE Syllabus focus:
'Candidates should evaluate profitability, liquidity and efficiency by interpreting ratios and comparing them with similar businesses and industry benchmarks.'
Accounting ratios become useful only when they are interpreted in context. Good evaluation explains what the ratios suggest about performance, whether the position is improving, and how the business compares with appropriate competitors.
What ratio evaluation means
Calculating a ratio is only the first step. Evaluation means turning the figure into a judgment about performance and financial position. This requires asking:
Is the ratio high or low?
Has it improved or worsened over time?
How does it compare with similar businesses?
How does it compare with an industry benchmark?
A useful starting point is an industry benchmark.
Industry benchmark: An average or accepted standard ratio for businesses operating in the same industry, used as a basis for comparison.
A single ratio, on its own, rarely gives a complete picture. Ratios should be interpreted together, because profitability, liquidity, and efficiency often affect one another.
Using trend and comparative analysis
Interpretation is stronger when ratios are examined over more than one accounting period. This shows whether performance is stable, improving, or deteriorating.
This is often called trend analysis.
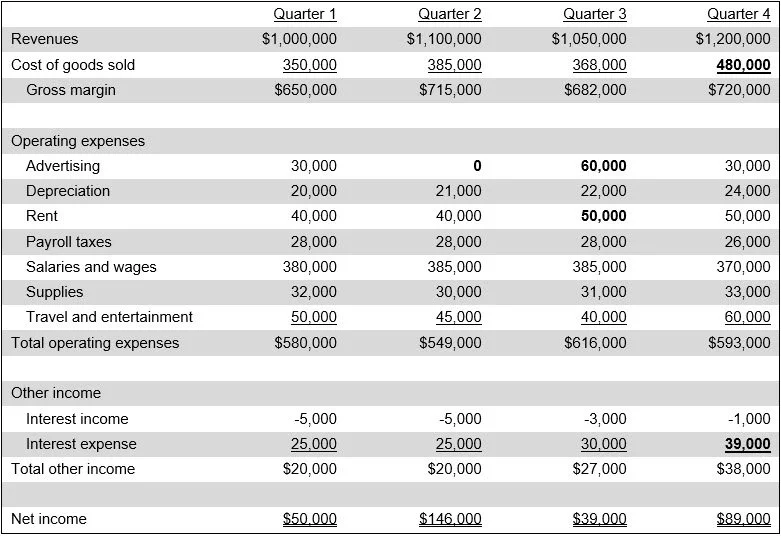
This example presents financial statement figures across four quarters in a consistent, side-by-side format. It illustrates how trend analysis highlights patterns and anomalies over time (for example, a jump in cost of goods sold or advertising) that could affect subsequent ratio interpretation. Source
Trend analysis: The assessment of changes in accounting ratios over time in order to identify patterns or direction of performance.
Trend analysis is most useful when the same accounting methods are used from one year to the next.
Interpreting profitability ratios
Profitability ratios assess how successfully a business turns revenue and capital into profit. When evaluating them, focus on causes as well as results.
A higher gross profit margin than a competitor or benchmark may suggest stronger pricing, better purchasing, or more effective control of the cost of sales.
A lower gross profit margin may suggest price competition, rising purchase costs, theft, wastage, or poor inventory control.
A higher profit margin usually indicates better control of operating expenses as well as gross profit.
A stronger return on capital employed suggests the business is using its long-term finance effectively to generate profit.
However, higher profitability is not automatically good. It may come from charging high prices that cannot be maintained, cutting essential expenses, or holding too little inventory. Evaluation should therefore connect the ratio to the business situation.
When comparing profitability ratios, make sure the businesses are genuinely comparable. A luxury retailer and a discount retailer may have very different margins, even if both are successful.
Interpreting liquidity ratios
Liquidity ratios assess the ability of a business to meet short-term obligations as they fall due. Interpretation should consider both risk and efficiency.
A low current ratio or acid test ratio may indicate difficulty in paying suppliers, wages, or other current liabilities.

This formula diagram defines the current ratio as current assets divided by current liabilities. It reinforces that liquidity interpretation depends on both the size and composition of short-term resources (current assets) relative to short-term obligations (current liabilities). Source
If liquidity ratios are improving, the business may be managing working capital more safely.
If liquidity ratios are worsening, short-term financial pressure may be increasing.
A very high liquidity ratio is not always a strength. It may show that too much cash is idle, receivables are collected slowly, or inventory levels are excessive. A business may therefore appear safe but still be using resources inefficiently.
The business type matters. A supermarket may operate with lower liquidity ratios than a manufacturing firm because it receives cash quickly from customers and may have rapid inventory turnover. Interpretation should therefore reflect normal conditions in that industry.
Interpreting efficiency ratios
Efficiency ratios assess how effectively the business uses its assets and manages working capital.
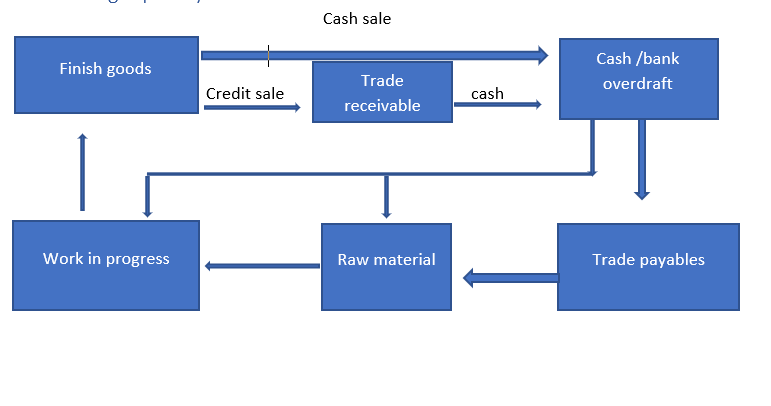
This diagram shows the working capital (cash) cycle, linking inventory, trade receivables, and trade payables to the timing of cash outflows and inflows. It helps explain why efficiency ratios such as inventory turnover, receivables turnover, and payables turnover are interconnected in real business operations. Source
Faster trade receivables turnover usually improves cash flow and reduces the risk of bad debts.
Slower receivables turnover may suggest weak credit control or a deliberate policy of giving customers longer to pay.
Faster inventory turnover may indicate strong demand or efficient inventory management, but it may also suggest inventory levels are too low.
Slower inventory turnover may point to overstocking, obsolete goods, or weak sales.
Longer payables turnover can improve short-term cash flow, but paying suppliers too slowly may damage supplier relationships or lose early payment discounts.
Higher non-current asset turnover suggests assets are being used productively to generate revenue.
A ratio should never be judged in isolation. For example, a business may improve receivables turnover by tightening credit terms, but this could reduce sales and weaken profitability.
Comparing with similar businesses and benchmarks
Comparisons are only meaningful when they are like-for-like.
Like-for-like comparison: A comparison made between businesses that are sufficiently similar in activity, size, structure, and accounting basis to make the ratios meaningful.
When comparing with similar businesses or industry benchmarks, consider:
the nature of the industry
the size and scale of operations
whether the businesses sell similar products
whether they use similar accounting policies
whether the data relates to the same accounting period
Industry benchmarks are useful because they show whether a business is above or below a typical level. However, the benchmark is not a target that automatically defines success. Some businesses outperform the industry by design, while others may operate safely with ratios below the benchmark because of their business model.
Making balanced evaluative comments
Strong evaluation does more than label a ratio as “good” or “bad.” It should:
identify what the ratio suggests
compare it with another period, similar business, or benchmark
explain a likely reason
comment on whether the position is favorable, unfavorable, or mixed
Balanced evaluation often recognizes trade-offs:
strong profitability may be achieved with weak liquidity
improved liquidity may result from holding excessive current assets
efficient payment to suppliers may reduce cash available for other needs
The best answers use ratios to support judgment, not to replace it. A business should be assessed through a pattern of ratios rather than a single figure, with clear reference to similar businesses and relevant industry standards.
Practice Questions
A business has an acid test ratio below the industry benchmark. State two points this may suggest about the business’s liquidity. [2]
The business may be less able than the average firm in the industry to meet short-term obligations. (1)
The business may be facing short-term cash pressure or weak working capital management. (1)
Business A and Business B operate in the same industry.
Business A: gross profit margin 32%, profit margin 10%, current ratio 0.9:1, inventory turnover 80 days.
Business B: gross profit margin 28%, profit margin 12%, current ratio 1.6:1, inventory turnover 55 days.
Industry averages: gross profit margin 30%, profit margin 11%, current ratio 1.3:1, inventory turnover 60 days.
Evaluate the profitability, liquidity, and efficiency of Business A compared with Business B and the industry average. [6]
Award 1 mark for each valid evaluative point, up to 6 marks.
Possible answers:
Business A has a higher gross profit margin than Business B and the industry average, suggesting stronger pricing or better control of cost of sales. (1)
Business B has a higher profit margin than Business A, suggesting better control of operating expenses. (1)
Business B’s current ratio is above the industry average, so its liquidity appears stronger. (1)
Business A’s current ratio is below 1:1 and below the industry average, suggesting possible difficulty meeting short-term obligations. (1)
Business B’s inventory turnover is faster than the industry average, suggesting better inventory management. (1)
Business A’s slower inventory turnover may indicate overstocking or weaker sales. (1)
Overall, Business B appears more balanced because it combines stronger liquidity and efficiency with slightly stronger overall profitability. (1)
FAQ
Seasonal businesses may have ratios that change sharply during the year.
For example:
inventory may rise before peak sales periods
receivables may increase after busy months
liquidity may temporarily weaken when stock is built up
This means a year-end ratio may not represent the typical position of the business. When evaluating such a business, it is better to consider several periods or management commentary as well as the published ratios.
Both can be useful, but they answer different questions.
An industry average shows whether the business is above or below a typical standard.
A leading competitor shows what strong performance may look like in practice.
An average can hide wide differences between firms, while a top competitor may set a very demanding standard. The best evaluation often uses both, if reliable data is available.
If two businesses have different year-ends, their ratios may reflect different trading conditions.
For example, one set of accounts may be prepared:
just after a peak sales season
during a period of high inflation
after a temporary disruption in supply
This can distort comparison, especially for liquidity and efficiency ratios. A careful evaluator should note whether timing differences may explain part of the gap between businesses.
Yes. Ratios are important, but they are not the only factor.
A business may still be attractive if it has:
strong future growth potential
valuable brand strength
new products or markets
a temporary downturn rather than a long-term weakness
Investors and lenders may accept weaker current ratios if they believe future performance will improve. This is why ratio evaluation should be linked to the wider business situation.
Rapid price changes can make trend analysis less straightforward.
For example:
revenue may rise because prices increased, not because activity improved
asset values based on older costs may make performance look stronger than it really is
margins may move simply because costs and selling prices changed at different speeds
As a result, an improving ratio trend does not always mean genuine operational improvement. In periods of inflation or unstable prices, trends should be interpreted with extra care.