CIE Syllabus focus:
'Calculate contribution, interpret break-even charts, and calculate break-even point, contribution to sales ratio, target profit output and margin of safety.'
Contribution and break-even analysis help managers judge how sales volume affects costs and profit. These tools support pricing, planning, and short-term decisions by identifying the sales level needed to cover costs.
Contribution
Contribution shows how much sales revenue is left after variable costs have been deducted. That remaining amount first covers fixed costs, and only after fixed costs are fully covered does profit begin to arise.
Contribution: The amount from sales revenue remaining after variable costs are deducted; it is available to cover fixed costs and then profit.
Contribution can be measured per unit or in total, depending on the information provided in a question.
= contribution earned from one unit sold
= revenue from one unit sold
= variable cost of one unit
If contribution per unit is high, fewer units are needed to cover fixed costs. If contribution per unit falls, usually because selling price falls or variable costs rise, the break-even point increases. Managers therefore use contribution to judge the effect of pricing, cost control, and sales volume on profit potential.
Contribution to sales ratio
The contribution to sales ratio expresses contribution as a percentage of sales revenue. It is useful when comparing products or divisions with different selling prices because it focuses on the proportion of each sales dollar that contributes toward fixed costs and profit.
= percentage of sales revenue available to cover fixed costs and profit
= sales revenue minus total variable costs
= total sales revenue
A higher ratio means the business keeps more contribution from each dollar of revenue. This ratio is especially helpful when questions are based on sales revenue rather than unit output, or when managers want a quick way to estimate the effect of changes in sales on profit.
Break-even point
A business reaches break-even when total revenue equals total cost. At this stage there is no profit and no loss.
Break-even point: The level of output or sales at which total contribution equals fixed costs, so profit is zero.
In contribution terms, break-even is the point where all fixed costs have been fully covered.
= units that must be sold to make zero profit
= total fixed costs for the period
= amount each unit contributes toward fixed costs and profit
Break-even can be stated in units or in sales revenue. In unit-based questions, fixed costs are divided by contribution per unit. In revenue-based questions, fixed costs are divided by the contribution to sales ratio. Break-even is a planning measure, so it depends on the assumption that selling price, variable cost per unit, and fixed costs stay constant within the relevant range.
Interpreting break-even charts
A break-even chart presents costs, revenue, and output visually.
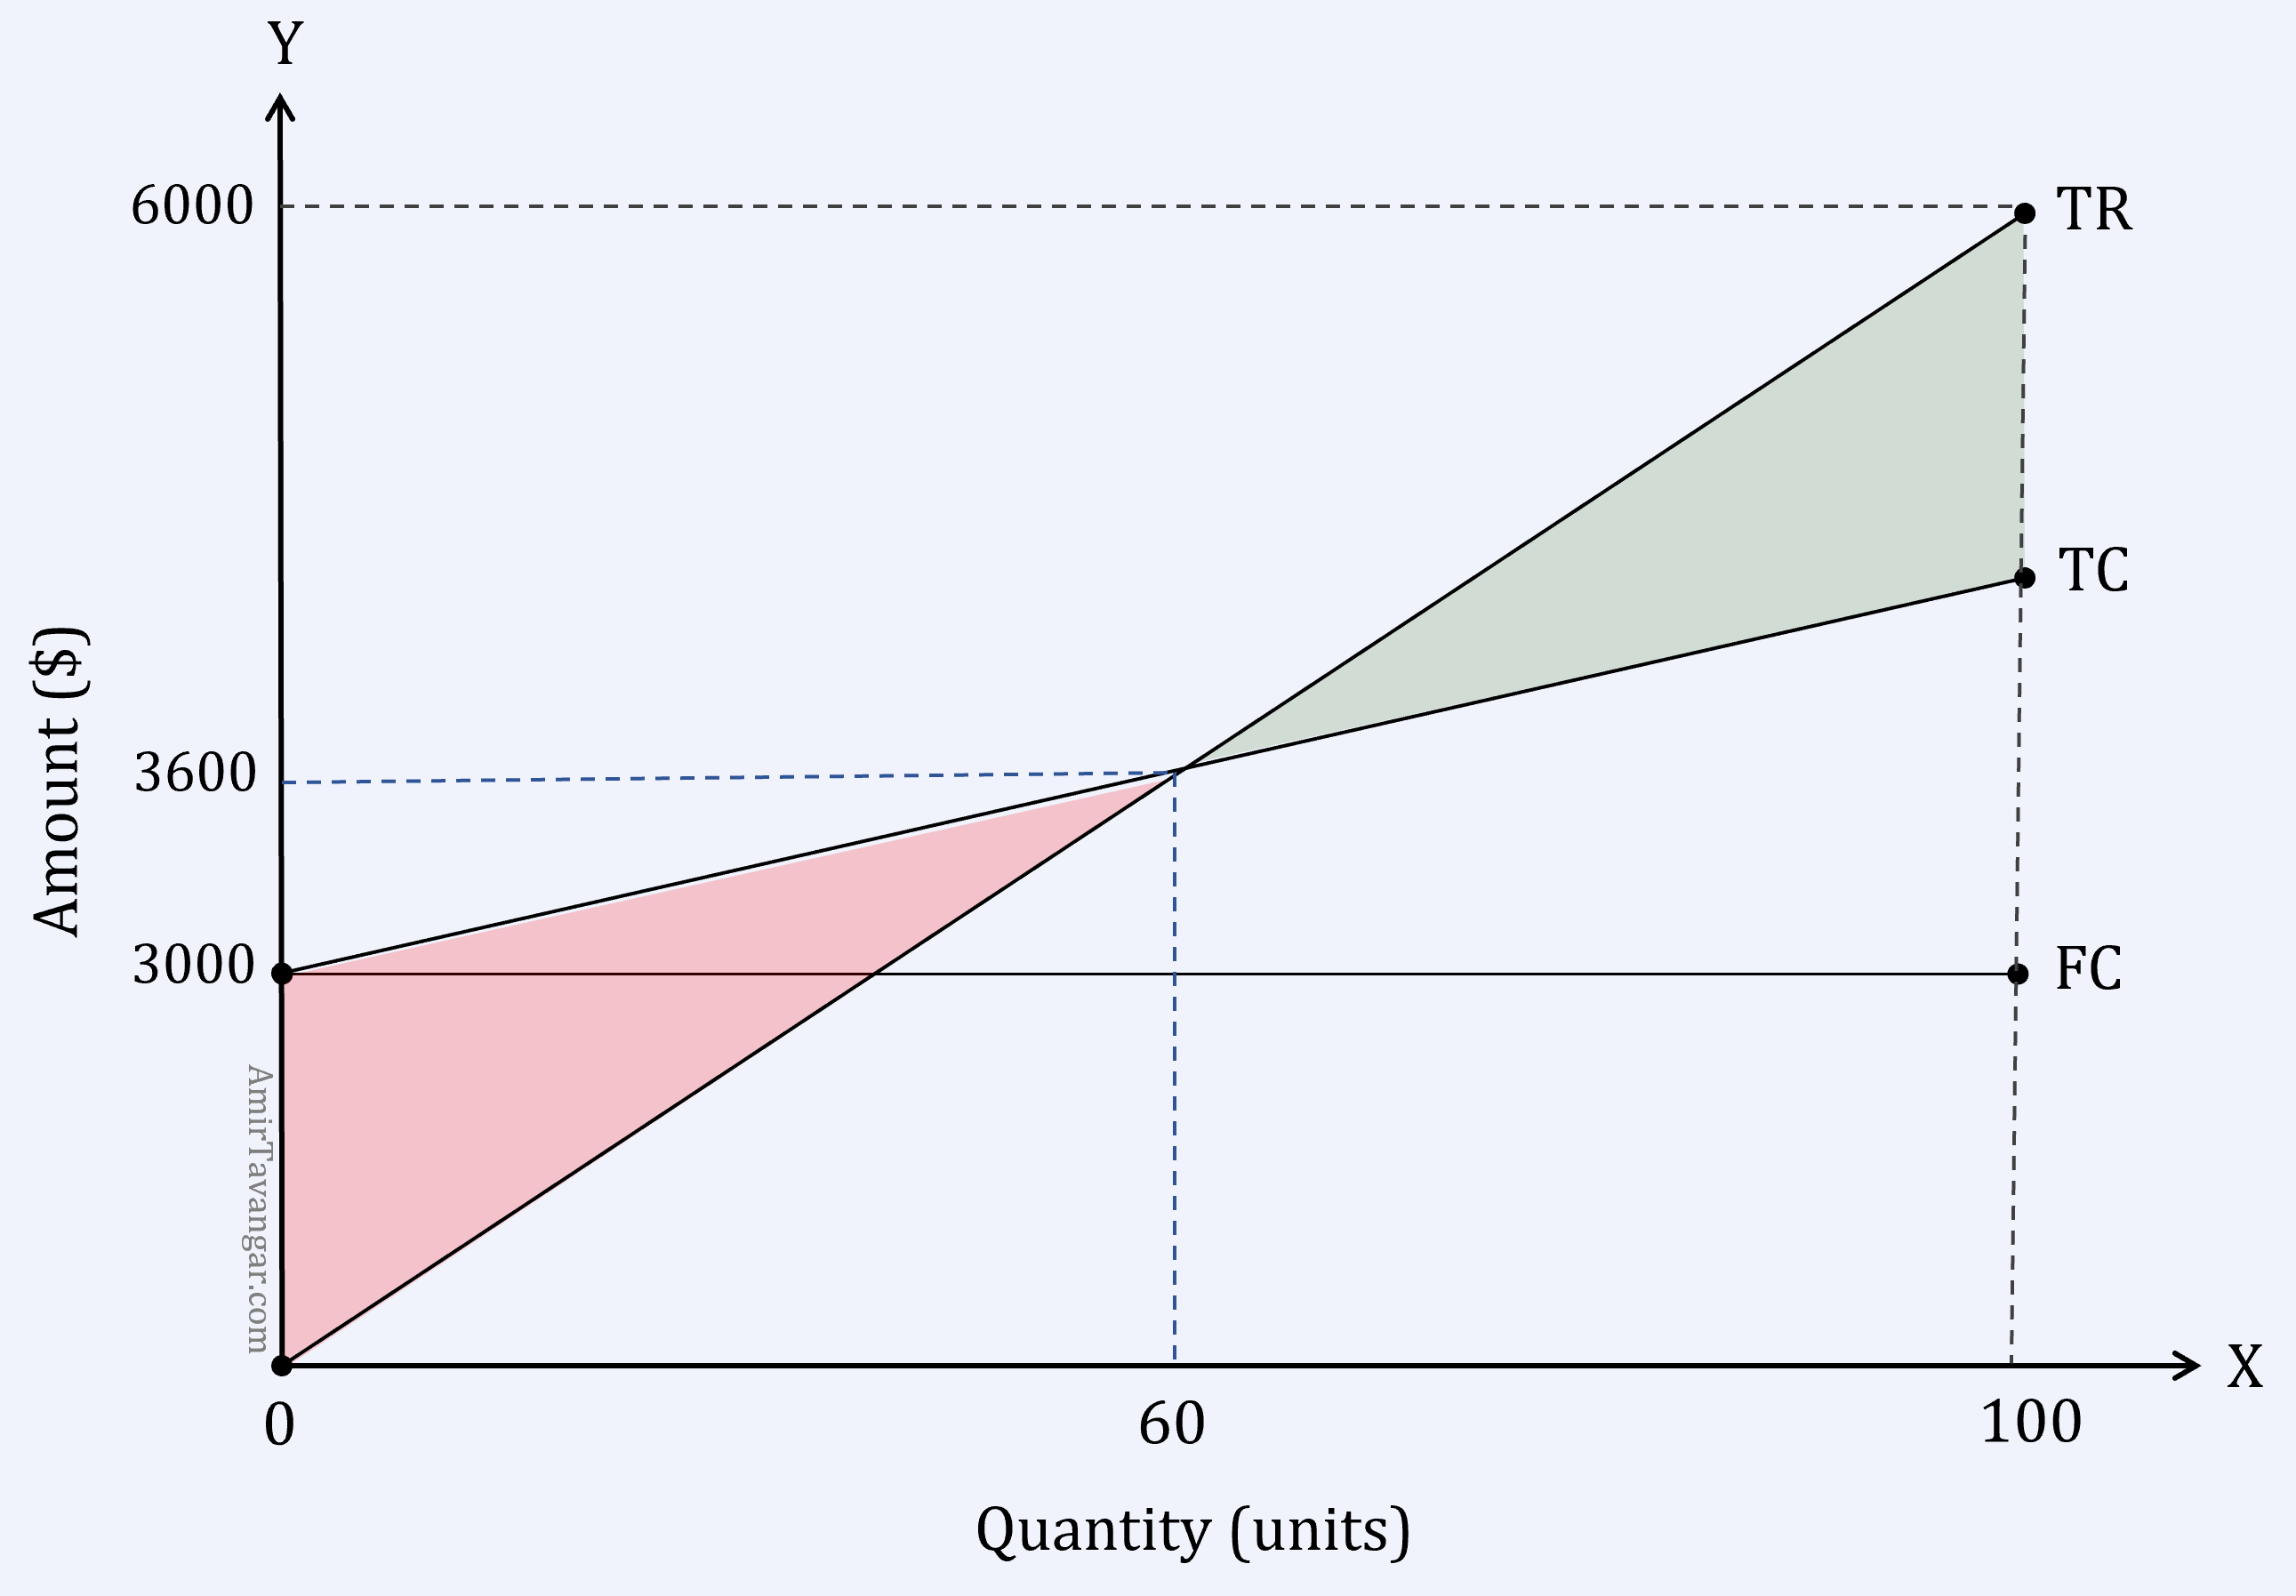
A standard break-even (cost–volume–profit) chart showing fixed costs (horizontal line), total costs (starting at fixed costs and rising with output), and total revenue (starting at the origin). The intersection of total revenue and total cost is the break-even point, separating the loss region (left) from the profit region (right). Source
Interpretation is important because exam questions may ask what the lines and areas show, not only for calculations.
The horizontal axis shows output or sales volume.
The vertical axis shows costs and revenue in money terms.
The fixed cost line is horizontal because fixed costs remain unchanged within the relevant range.
The total cost line begins at the level of fixed costs and then rises as variable costs are added.
The sales revenue line starts at zero and rises according to the selling price per unit.
The break-even point is where the sales revenue line crosses the total cost line.
To the left of break-even, the business makes a loss because total costs are above sales revenue.
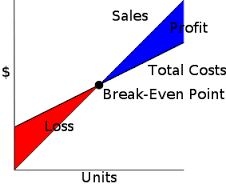
A simplified break-even chart highlighting how the area between the sales revenue line and total cost line represents loss before break-even and profit after break-even. It reinforces that break-even occurs where total revenue equals total costs, and that the relative positions of the lines determine profit or loss at any output level. Source
To the right of break-even, the business makes a profit because sales revenue is above total costs.
The slope of the lines also gives useful information. A steeper sales revenue line suggests a higher selling price per unit. A steeper total cost line suggests a higher variable cost per unit. If the gap between the sales line and the total cost line widens rapidly after break-even, profit rises more quickly as output increases.
Target profit output
Managers often need to know not just how to break even, but how many units must be sold to earn a planned profit. In that case, the target profit is added to fixed costs before calculating the required output.
= units required to earn a chosen profit
= total fixed costs for the period
= desired profit for the period
= contribution earned from one unit sold
The same logic can be applied when questions give sales revenue rather than units, using the contribution to sales ratio. This makes target profit analysis useful for budgets, sales planning, and performance targets.
Margin of safety
The margin of safety measures how much actual or budgeted sales exceed the break-even level. It indicates how far sales can fall before the business begins to make a loss.
Margin of safety: The excess of actual or budgeted sales over break-even sales.
This measure is closely linked to risk in short-term profit planning.
= excess of actual or budgeted sales over break even sales
= expected or actual sales level in units or revenue
= sales level at which profit is zero
A small margin of safety means the business is more vulnerable to a fall in demand. A large margin of safety provides a stronger buffer before losses occur. In examination questions, margin of safety may be required in units, in sales revenue, or as a percentage of actual or budgeted sales, so the wording of the requirement should be checked carefully.
Practice Questions
A product sells for 11 per unit.
Calculate the contribution per unit. (2 marks)
1 mark: subtract variable cost from selling price
1 mark: contribution per unit = $7
A business has fixed costs of 30 per unit. Variable cost is 24,000. (2 marks)
(d) Calculate the margin of safety in units based on the budgeted sales. (1 mark)
(6 marks)
(a) Contribution per unit = (48,000+24,000)\div 12$ (1 mark)
(c) Target profit output = 6,000 units (1 mark)
(d) Margin of safety = 5,000 - 4,000 = 1,000 units (1 mark)
FAQ
Unit-based break-even works best when a business sells one clearly measured product. It becomes less helpful when a firm sells many different products or services.
Revenue-based analysis is often better when:
output is mixed
units are hard to define
management plans in sales dollars rather than quantities
It gives a broader picture, but it depends on a reasonably stable contribution to sales ratio.
In a multi-product business, break-even depends on the combined contribution from all products, not just total sales revenue. If the mix changes, the average contribution can change even when total sales stay the same.
A shift toward lower-contribution products usually raises the break-even point.
A shift toward higher-contribution products usually lowers it.
This is why break-even analysis is more reliable when the expected sales mix is stable.
Break-even analysis assumes that selling price, variable cost per unit, and fixed costs remain constant over the relevant range. During inflation, heavy discounting, or volatile input costs, those assumptions may fail quickly.
As a result:
contribution may change from month to month
the break-even point may move frequently
charts drawn from older data may become misleading
Managers should then recalculate break-even figures regularly instead of relying on one static estimate.
Yes. A business may accept a low margin of safety for strategic reasons, such as launching a new product, entering a new market, or using introductory pricing to build demand.
However, this choice increases risk.
Management should monitor:
how long the low margin of safety will last
whether extra sales are realistic
whether the business has enough financial strength to absorb a temporary fall in profit
A low margin of safety may be acceptable, but usually only for a planned and controlled period.
Equal contribution per unit does not automatically mean equal business value. One product may sell steadily, while the other may have uncertain demand or require much stronger selling effort.
Managers may also consider:
how easy the product is to sell
how often customers reorder it
whether it supports the brand
whether its sales are seasonal or volatile
So contribution per unit is important, but it should not be the only basis for judgment.