Edexcel Syllabus focus:
'Analyse data on energy budgets and diet to understand energy intake, energy expenditure and nutritional decisions.'
Energy budget data helps show whether a person’s diet matches their needs. To analyze it well, compare energy consumed, energy used, and how reliable the diet record actually is.
Understanding energy budgets
Energy balance and units
An energy budget compares the energy taken in from food and drink with the energy used by the body over a period of time. This is usually considered per day, but a several-day average is often more useful because both eating patterns and activity levels vary.
Energy budget: The relationship between the energy taken in from food and drink and the energy used by the body over a period of time.
Energy in diet studies is usually recorded in kilojoules () or kilocalories (). Food labels often show both. When analyzing data, it is important to compare values using the same unit and over the same time period. A single day can be misleading if it included unusual exercise, a special event, or missed meals.
A simple way to express an energy budget is to compare intake and expenditure directly.
= Difference between intake and expenditure, in or
= Chemical energy obtained from food and drink, in or
= Energy used by body processes and activity, in or
If energy intake is greater than energy expenditure, the person is in positive energy balance. If expenditure is greater than intake, the person is in negative energy balance. When the two are very similar over time, the person is close to energy balance.
Energy intake
What intake data shows
Energy intake comes from all food and drink consumed. Diet analysis may use food diaries, recall questionnaires, or food labels to estimate how much energy a person takes in. Accurate intake data depends on careful recording.
Important features of intake data include:
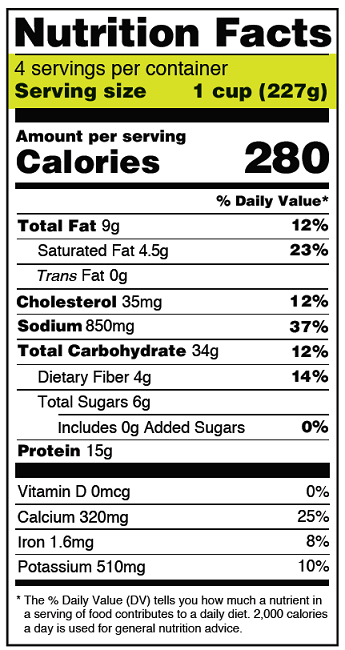
Sample Nutrition Facts labels illustrate how energy intake is recorded in practice (Calories per serving) and how serving size is defined using both a household measure and grams. This helps explain why accurate portion-size recording is essential when converting food diaries and labels into daily energy-intake totals. Source
the mass or portion size of each food
the energy value per serving or per
how often meals, snacks, and drinks are consumed
whether high-energy items such as sauces, oils, and sweetened drinks have been included
Intake data should not be judged in isolation. A high daily intake may be appropriate for a very active person, while the same intake may be excessive for someone with a much lower energy demand. This means that diet analysis is most useful when intake is compared with expenditure, age, sex, body size, and typical activity level. It is also important to remember that liquid calories are easy to overlook, so drinks can significantly affect the final total.
Energy expenditure
Why expenditure changes
Energy expenditure is the total amount of energy the body uses. It is not fixed. It changes between individuals and can also vary from one day to the next in the same person.
Main contributors to expenditure include:
Basal metabolic rate: energy used at rest to maintain vital processes such as breathing, heartbeat, active transport, and temperature regulation
Physical activity: movement of skeletal muscles during exercise and daily tasks
Thermoregulation: extra energy needed to maintain body temperature, especially in colder conditions
Growth and tissue repair: energy needed to make new cells and repair damaged tissues
Illness or fever: these can raise metabolic demand
For many people, physical activity causes the largest short-term changes in expenditure. However, basal metabolic rate still accounts for a large proportion of daily energy use. When analyzing data, do not assume that two people with the same diet need the same amount of energy. Their expenditure may differ because of activity level, body composition, age, or metabolic rate.
Analyzing diet data
Looking for meaningful patterns
To analyze an energy budget, compare intake data with expenditure data collected over the same period. The aim is to identify patterns rather than focus on one isolated figure. Average values across several days are often more meaningful than a single day’s result.
Useful questions to ask when interpreting data include:
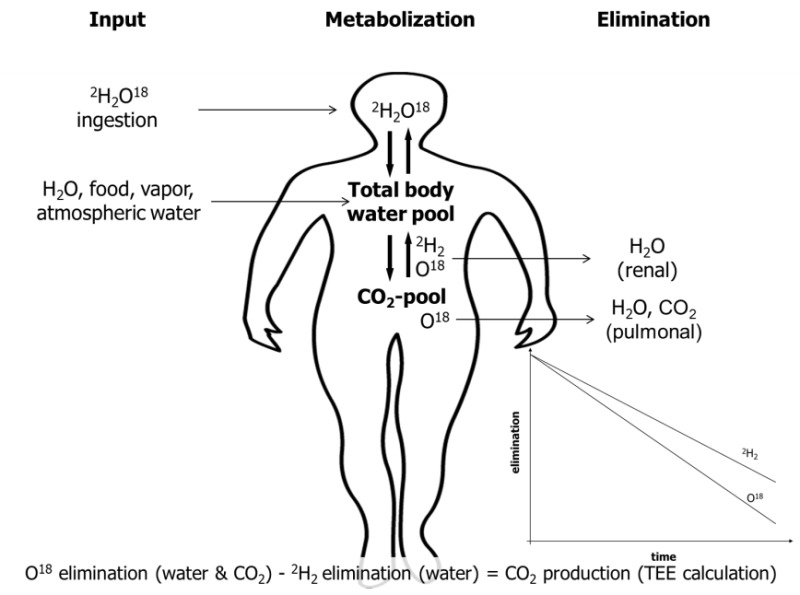
A schematic of the doubly labeled water method shows how stable isotopes (deuterium and oxygen-18) are used to estimate production, which can be converted into total energy expenditure over time. This provides a clear example of a direct measurement approach, contrasting with less precise activity-based estimates. Source
Is intake usually above, below, or close to expenditure?
Are weekends different from school or work days?
Are snacks and drinks recorded as carefully as main meals?
Is expenditure measured directly, or only estimated?
Reliable interpretation depends on data quality. People often underestimate portion size, forget snacks, or fail to record drinks. Energy expenditure may also be estimated from activity level rather than measured accurately. This means the final energy budget is usually an approximation, not an exact value. Even so, it can still be very useful if the record is detailed and covers a realistic period of normal behavior.
Diet analysis should also consider that the same total energy intake can come from very different eating patterns. For example, two diets may provide similar energy totals but differ in meal timing, portion distribution, and food choice. These differences may affect nutritional decisions even when the total energy figure looks similar.
Making nutritional decisions
Using evidence rather than guesswork
A nutritional decision is a choice about diet based on evidence from intake and expenditure data. The purpose is to make food intake more appropriate for the person’s needs. Good decisions are based on repeated patterns, not one unusual day.
Examples of evidence-based decisions include:
increasing intake if a person consistently uses more energy than they consume
reducing intake if there is a repeated surplus
checking portion sizes if recorded intake seems unexpectedly high or low
reviewing snacks and drinks if these are adding substantial energy
adjusting intake to match changes in training, work, or routine
These decisions should be realistic and linked to the data. A person with a sustained energy deficit may need larger meals or more frequent snacks. A person with a sustained surplus may need smaller portions, different food choices, or higher activity. The key idea is that diet analysis supports reasoned choices based on measured or recorded evidence, rather than guesses or assumptions about what a person “should” be eating.
Practice Questions
State two factors that can increase a person’s daily energy expenditure. (2 marks)
1 mark for each correct factor, up to 2 marks.
Acceptable answers include:
increased physical activity
growth
tissue repair
cold conditions causing greater thermoregulation
illness or fever
higher basal metabolic rate
A student records a mean daily energy intake of over 7 days. Their estimated mean daily energy expenditure is .
Explain what these data suggest about the student’s energy budget. Suggest one appropriate nutritional decision and give two reasons why the data should be interpreted cautiously. (6 marks)
intake is greater than expenditure (1)
student is in positive energy balance / has an energy surplus (1)
identifies surplus of per day (1)
appropriate nutritional decision suggested, such as reducing energy intake, increasing activity, or reviewing portion sizes/snacks (1)
one reason for caution, such as 7 days may not represent usual routine / unusual week / weekday-weekend variation (1)
second reason for caution, such as underreporting of food, inaccurate portion sizes, missed drinks/snacks, or expenditure being estimated rather than measured (1)
FAQ
Both units measure energy.
$kJ$ is the SI unit used in science.
$kcal$ is still widely used in nutrition and everyday diet advice.
Showing both makes labels easier to use for different audiences. In the UK, many students and adults still recognize $kcal$ more quickly, while $kJ$ matches scientific reporting.
Manufacturers usually estimate it from the amounts of carbohydrate, fat, protein, and sometimes fiber in the food.
Standard conversion factors are applied to each nutrient to give an overall energy value. This approach is more practical than testing every product by direct combustion.
The final label value is therefore a calculated estimate, not a perfectly exact measure of what every person will absorb.
Wearables use algorithms, not direct measurement of total energy expenditure.
They may estimate expenditure from:
heart rate
movement
body mass
age
sex
Accuracy can vary because the device may not detect resistance exercise, cycling, carrying loads, or changes in fitness level well. Different brands also use different formulas, so two devices can give different results for the same activity.
Adolescence is a period of rapid biological change.
Energy needs may shift because of:
growth spurts
changes in muscle mass
hormone changes
changes in activity or sport participation
This means an intake that was appropriate earlier in the year may later become too low or too high. Repeated diet analysis is more useful than assuming needs stay constant.
Total energy alone does not show the full pattern of eating.
Two diets may have the same energy total but differ in:
meal timing
portion distribution across the day
amount of energy from drinks
level of satiety after meals
For example, a diet based heavily on drinks and snacks may be harder to manage than one with similar energy spread across balanced meals. That is why diet analysis should look at patterns as well as totals.