Edexcel Syllabus focus:
'Investigate how enzyme concentration and substrate concentration affect the initial rates of reactions in Core Practical 4.'
These notes focus on how to measure and compare initial enzyme reaction rates and how experimental changes in enzyme or substrate concentration affect the pattern of results.
Measuring initial rates
The initial rate is measured as close as possible to time zero, before major changes in substrate and product levels occur. This makes comparisons between different concentrations more valid.
Initial rate: The rate of an enzyme-controlled reaction measured at the very start of the reaction, when substrate concentration has changed very little.
In practical work, initial rate data are taken from the earliest part of the reaction, when the effect of the chosen variable can be seen most clearly.
Insert takeaways content here...
= change in amount, concentration, or volume of product formed
= time interval in
If the reaction is followed continuously, the initial rate is estimated from the gradient at the start of the graph. If the method uses a fixed visible change, shorter times indicate faster initial rates.
Why initial rates are used
Substrate concentration has not fallen much yet.
Product accumulation is still low.
The measured rate is more directly linked to the variable being tested.
Results from different trials are easier to compare fairly.
Investigating the effect of enzyme concentration
When investigating enzyme concentration, the enzyme is the independent variable and the initial rate is the dependent variable. The substrate concentration must stay the same in every trial.
Practical design
A typical investigation should:
prepare a range of enzyme concentrations
add the same volume and concentration of substrate to each trial
keep the total reaction volume the same
control temperature with a water bath
control pH with a buffer
start the reaction in the same way each time
measure the initial rate immediately
repeat each concentration and calculate a mean
The method of measuring rate depends on the reaction used. Students may measure product formation, such as gas production, or the disappearance of a substrate. The important point is that the same measurement method is used throughout.
Expected pattern
If substrate is present in sufficient amount, increasing enzyme concentration increases the initial rate. This is because more enzyme molecules provide more active sites for substrate molecules to bind to at the start of the reaction.
At lower enzyme concentrations, the graph of initial rate against enzyme concentration is often close to a straight line through the origin.
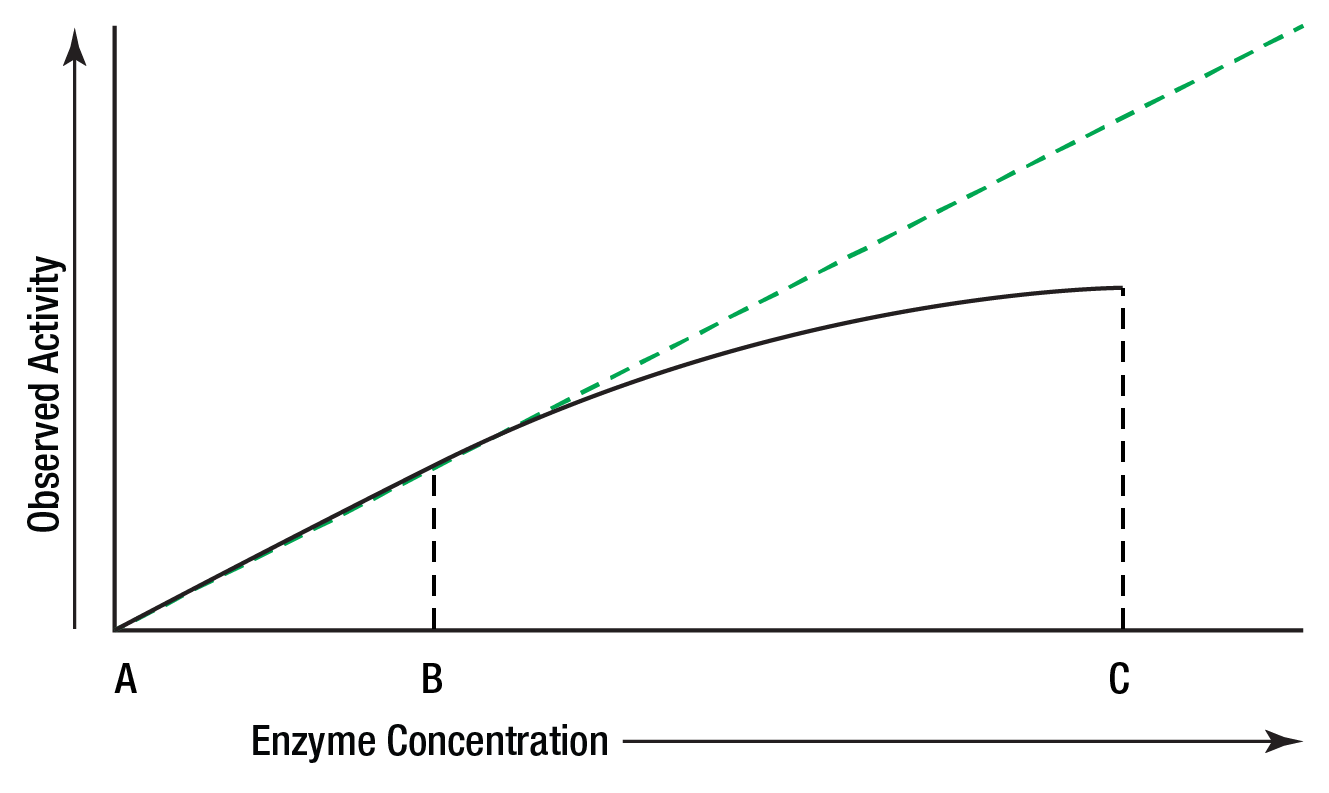
Observed activity versus enzyme concentration, showing an initially near-linear region where rate is proportional to enzyme concentration. The departure from linearity at higher enzyme concentrations illustrates how the assay can become limited by other factors (e.g., substrate availability during the measurement interval). Source
This means that doubling enzyme concentration can roughly double the initial rate.
However, this pattern will not continue indefinitely. If enzyme concentration becomes high while substrate is unchanged, substrate may become the limiting factor. The increase in rate then becomes smaller.
Investigating the effect of substrate concentration
When investigating substrate concentration, the substrate is the independent variable and enzyme concentration must remain constant.
Practical design
A fair test should:
prepare a range of substrate concentrations
add the same volume and concentration of enzyme to each trial
keep temperature, pH, and total volume constant
use the same mixing technique each time
measure the initial rate using the same timing and apparatus
repeat each concentration and calculate a mean
Only one variable should change. If both enzyme concentration and substrate concentration change together, the effect of each cannot be separated.
Expected pattern
As substrate concentration increases, the initial rate first increases. More substrate molecules are available, so collisions with active sites happen more frequently.
At higher substrate concentrations, the graph levels off and reaches a maximum rate.
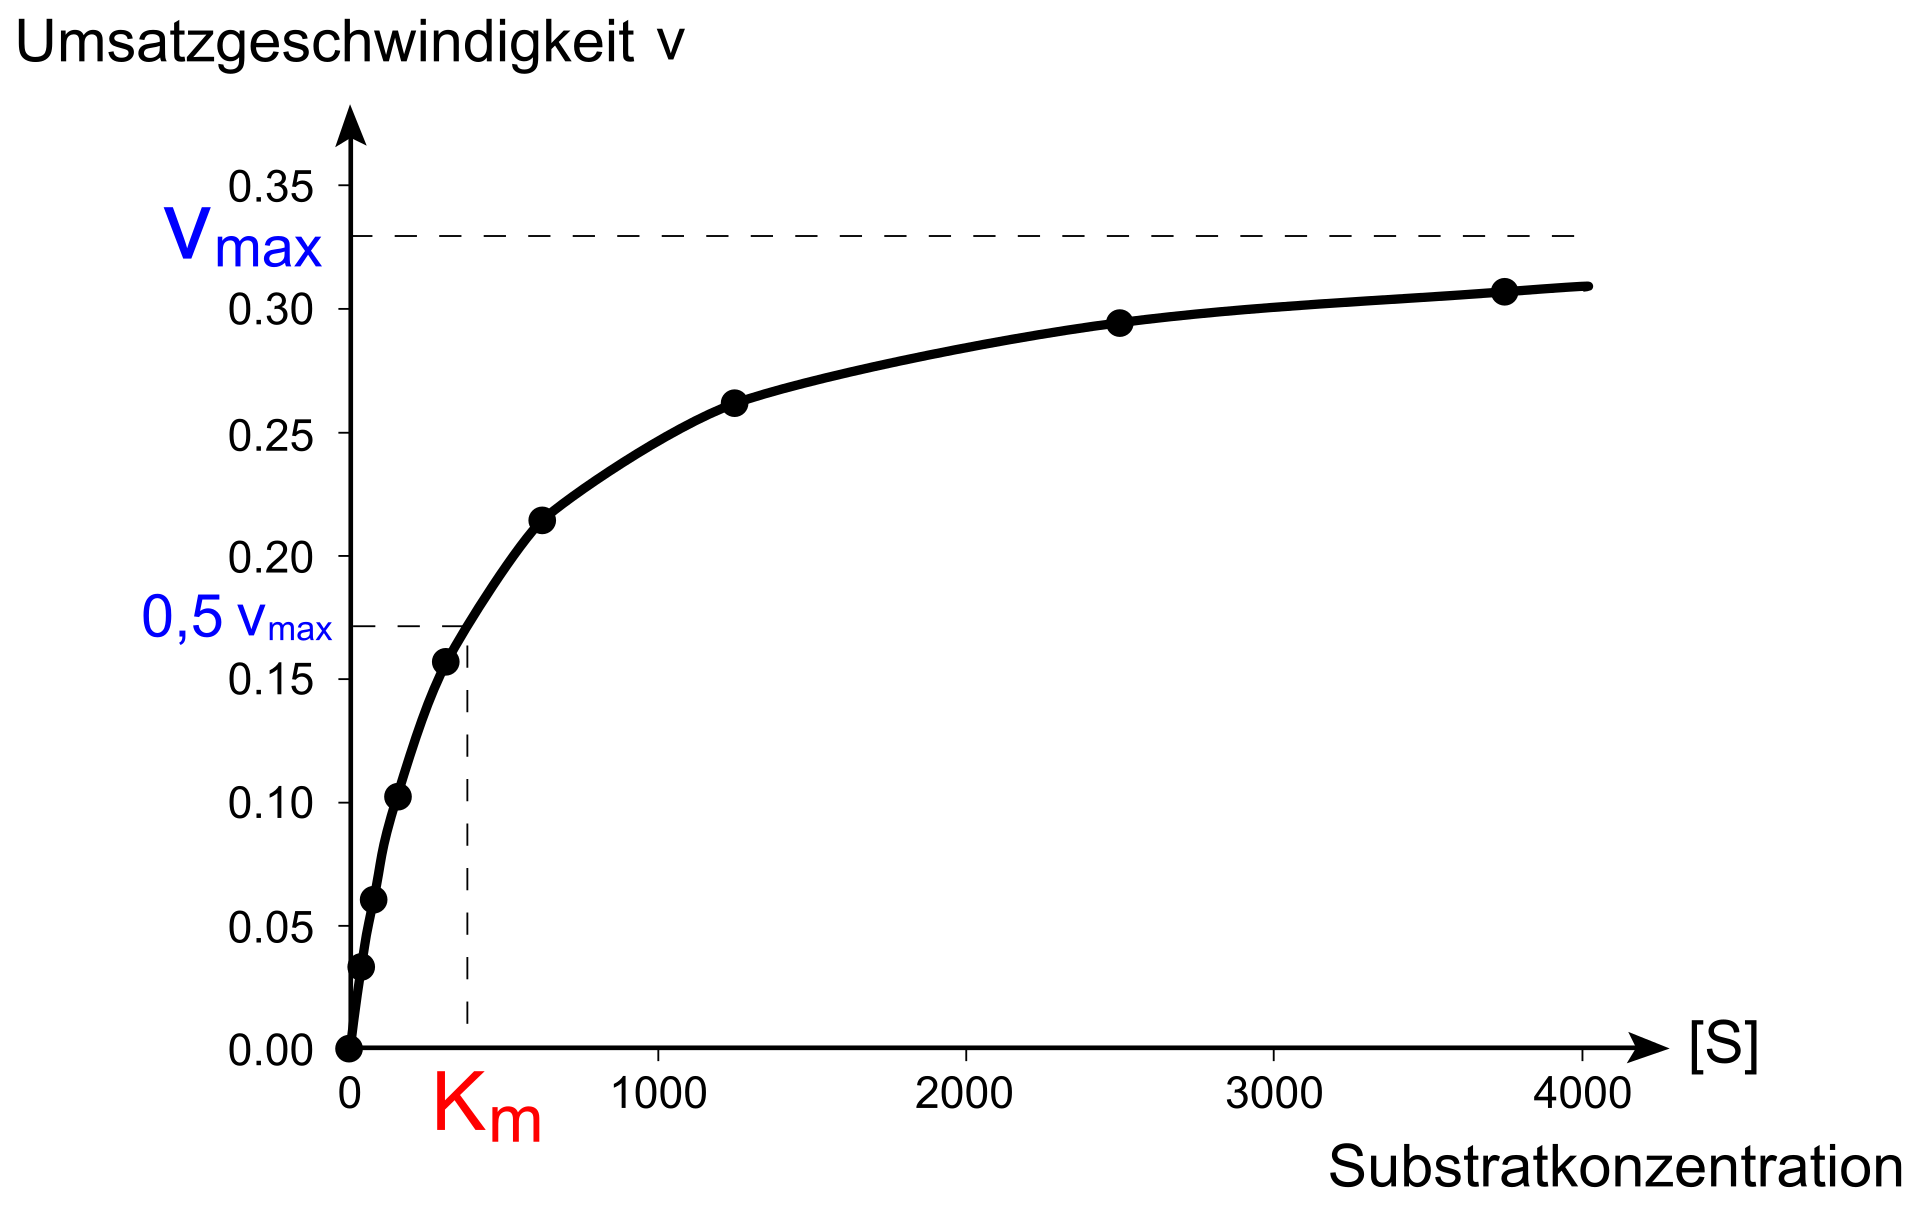
Michaelis–Menten saturation curve for initial reaction rate versus substrate concentration. It visualizes the rapid rise in initial rate at low substrate concentration and the plateau at high substrate concentration when active sites are saturated (approaching ). Source
This happens because the enzyme molecules are working at full capacity. Most active sites are occupied, so adding more substrate does not increase the initial rate further.
This leveling off is an important feature of enzyme investigations. It shows that the enzyme concentration is now limiting.
Controlling variables and improving reliability
A valid investigation changes only one factor at a time. The other conditions must be kept constant so that any change in initial rate can be linked confidently to the chosen concentration.
Important control variables include:
temperature
pH
total reaction volume
volume of enzyme added
volume of substrate added
timing method
mixing method
measurement apparatus
Careful control matters because enzyme activity is sensitive to changes in conditions. For example, a rise in temperature could increase rate even if concentration had stayed the same.
Reliability is improved by:
carrying out repeats
spotting and checking anomalous results
calculating a mean
using the same apparatus for all trials
preparing concentrations accurately
Because initial rates depend on the earliest part of the reaction, even a small delay after mixing can reduce accuracy. Good organization and consistent technique are therefore essential.
Presenting and interpreting results
Results are usually plotted with concentration on the x-axis and initial rate on the y-axis. The shape of the graph helps interpret the results.
For enzyme concentration:
the initial rate often rises in direct proportion at first
this suggests substrate is not yet limiting
a reduced rise at higher concentrations suggests substrate is becoming limiting
For substrate concentration:
the initial rate rises steeply at first
the graph then plateaus
the plateau shows that enzyme molecules are already fully occupied most of the time
When interpreting data, check whether:
the trend matches the expected graph shape
repeated values are similar
any anomalous points need to be repeated
control variables were maintained successfully
A strong practical investigation links changes in initial rate clearly to either enzyme concentration or substrate concentration, not to uncontrolled experimental differences.
Practice Questions
Explain why the initial rate of an enzyme-controlled reaction is measured rather than the rate later in the reaction. (2 marks)
substrate concentration has changed very little / substrate has not been significantly used up (1)
product has not built up much yet / the effect of the chosen variable can be measured more fairly at the start (1)
A student investigates the effect of substrate concentration on the initial rate of an enzyme-controlled reaction. Describe how the student should carry out the investigation and explain the pattern expected in the results. (6 marks)
prepare a range of substrate concentrations (1)
keep enzyme concentration the same in every trial (1)
control temperature and pH / keep other variables constant (1)
measure the initial rate in the same way each time, starting immediately after mixing (1)
repeat each concentration and calculate a mean (1)
initial rate increases at first because more substrate molecules collide with active sites / more enzyme-substrate complexes form (1)
rate then levels off because active sites become fully occupied / enzyme concentration becomes limiting (1)
Maximum 6 marks.
FAQ
A pilot study helps you choose a practical concentration range before collecting final data.
It can show:
whether the reaction is too fast or too slow
how long measurements should last
whether the equipment is sensitive enough
This saves time and helps produce a full set of usable initial-rate results.
Serial dilutions are often more accurate than preparing every concentration from scratch.
They help by:
reducing measuring errors
giving evenly spaced concentration values
making preparation faster and more organized
They are especially useful when many enzyme or substrate concentrations are needed for a graph.
Counting bubbles is less reliable because bubble size is not constant.
A gas syringe is usually better because it:
measures actual gas volume
gives numerical data
makes small differences between rates easier to detect
It is still important to check for leaks, because leaks will reduce the measured volume.
If the reaction is too fast, the earliest changes may be missed.
Possible fixes include:
using a lower enzyme concentration
using a lower substrate concentration
taking readings with a data logger or sensor
choosing a method with faster timing or detection
A short pilot test is the best way to identify this problem before the final experiment.
A colorimeter is useful when the reaction causes a color change or a change in cloudiness.
It can improve the investigation by:
giving objective readings instead of judging color by eye
allowing frequent measurements over short time intervals
making it easier to estimate the starting gradient accurately
This is especially helpful when the visible change is subtle.