
IB Syllabus focus: 'Psychological evidence may be direct or indirect, quantitative, qualitative, or a mixture of both.'
Psychologists collect many kinds of evidence because behavior is complex and often partly hidden. Understanding what type of data a study uses helps students judge what findings mean and how convincing they are.
Psychological evidence and what it shows
In psychology, data are the information collected to answer a research question. Some evidence is direct, meaning the researcher records behavior or responses more immediately, such as counting helping acts or recording spoken answers during an interview. Other evidence is indirect, meaning the researcher infers a psychological process from an indicator, such as questionnaire scores, reaction times, or hormone levels.
Direct and indirect do not mean “good” versus “bad.” Many important constructs, including memory, emotion, prejudice, and stress, cannot be observed directly. As a result, psychological research often depends on indirect signs that stand in for the construct being studied.
A useful way to think about this is that evidence can vary on more than one dimension at the same time:
Direct + quantitative: frequency of eye contact in an observation
Direct + qualitative: words used by participants in a discussion
Indirect + quantitative: score on an anxiety scale
Indirect + qualitative: interview accounts used to infer coping style
Quantitative data
Psychologists often separate quantitative data from other forms of evidence.
Quantitative data: Data presented in numerical form, such as scores, counts, ratings, percentages, or measurements.
Quantitative data make comparison easier because they can be summarized with statistics. Researchers can calculate averages, identify patterns across participants, and examine whether differences are likely to be meaningful rather than random. This makes quantitative data especially useful when a study asks questions about how much, how often, or whether one group differs from another.
Common sources of quantitative data include:
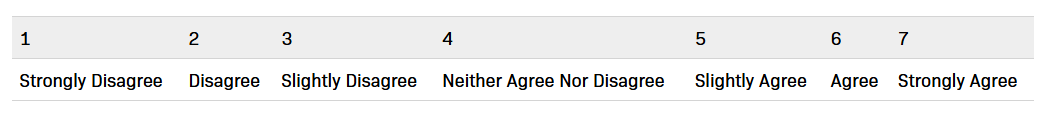
Example of a 7-point Likert response scale with clearly labeled anchors from “Strongly Disagree” to “Strongly Agree.” This illustrates how subjective self-reports (an indirect indicator of constructs like attitudes, stress, or anxiety) can be standardized into numerical data suitable for statistical comparison. Source
survey ratings on a scale
test scores
frequency counts from observations
duration measures, such as time spent on a task
physiological readings, such as heart rate
A major strength of quantitative data is that they are often efficient to compare across large groups. Numerical evidence can show trends that would be difficult to see from individual accounts alone. If a researcher wants to know whether sleep deprivation lowers attention scores, quantitative data are usually central.
However, numbers can simplify complex behavior. A score may show that anxiety increased, but it may not explain what that anxiety felt like or why participants interpreted the situation differently. Quantitative data are powerful for identifying patterns, but they can miss context and personal meaning.
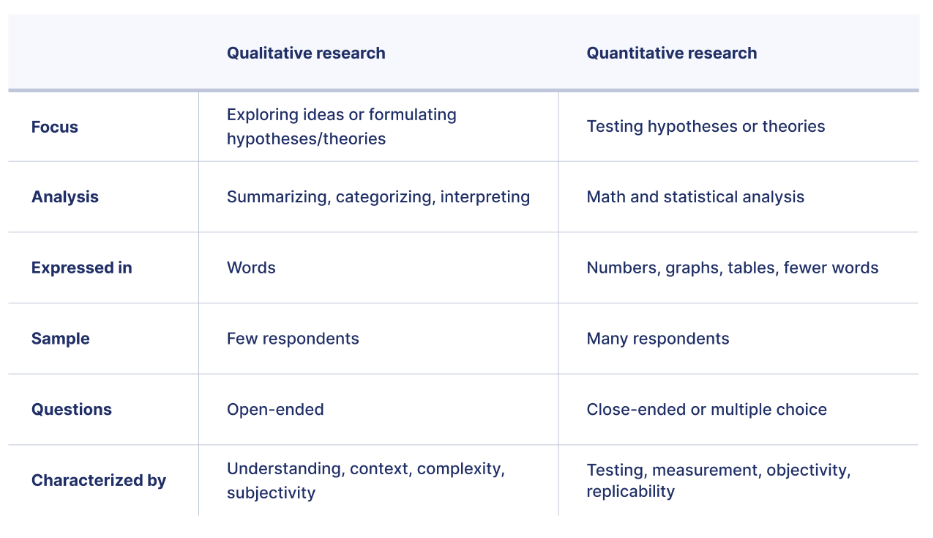
Side-by-side table contrasting qualitative and quantitative research across core dimensions (focus, analysis style, how results are expressed, sample size tendencies, and question formats). This visual reinforces that the two approaches are not “better vs. worse,” but are optimized for different kinds of psychological questions (e.g., explanation and meaning vs. measurement and comparison). Source
Qualitative data
Psychologists may also collect qualitative data when they want richer descriptions of experience.
Qualitative data: Non-numerical data, usually expressed through words, meanings, descriptions, narratives, images, or themes.
Qualitative data are useful when researchers want to understand how people interpret events, construct identities, or explain their own behavior. Interviews, open-ended questionnaires, focus groups, diaries, and detailed observations often produce qualitative material. Instead of asking only “how much,” qualitative research often asks “how” and “why.”
This kind of evidence is especially valuable when a topic is new, sensitive, or culturally complex. It allows participants to answer in their own words rather than being forced into fixed response categories. As a result, researchers may notice unexpected themes that would have been missed in a fully numerical design.
At the same time, qualitative data take longer to collect and analyze. Researchers usually identify patterns by coding responses and grouping them into categories or themes. Because interpretation matters, qualitative findings must be justified carefully with clear links between the raw data and the researcher’s claims.
Mixed data
Many psychological investigations use a mixed-methods approach, bringing together quantitative and qualitative evidence.
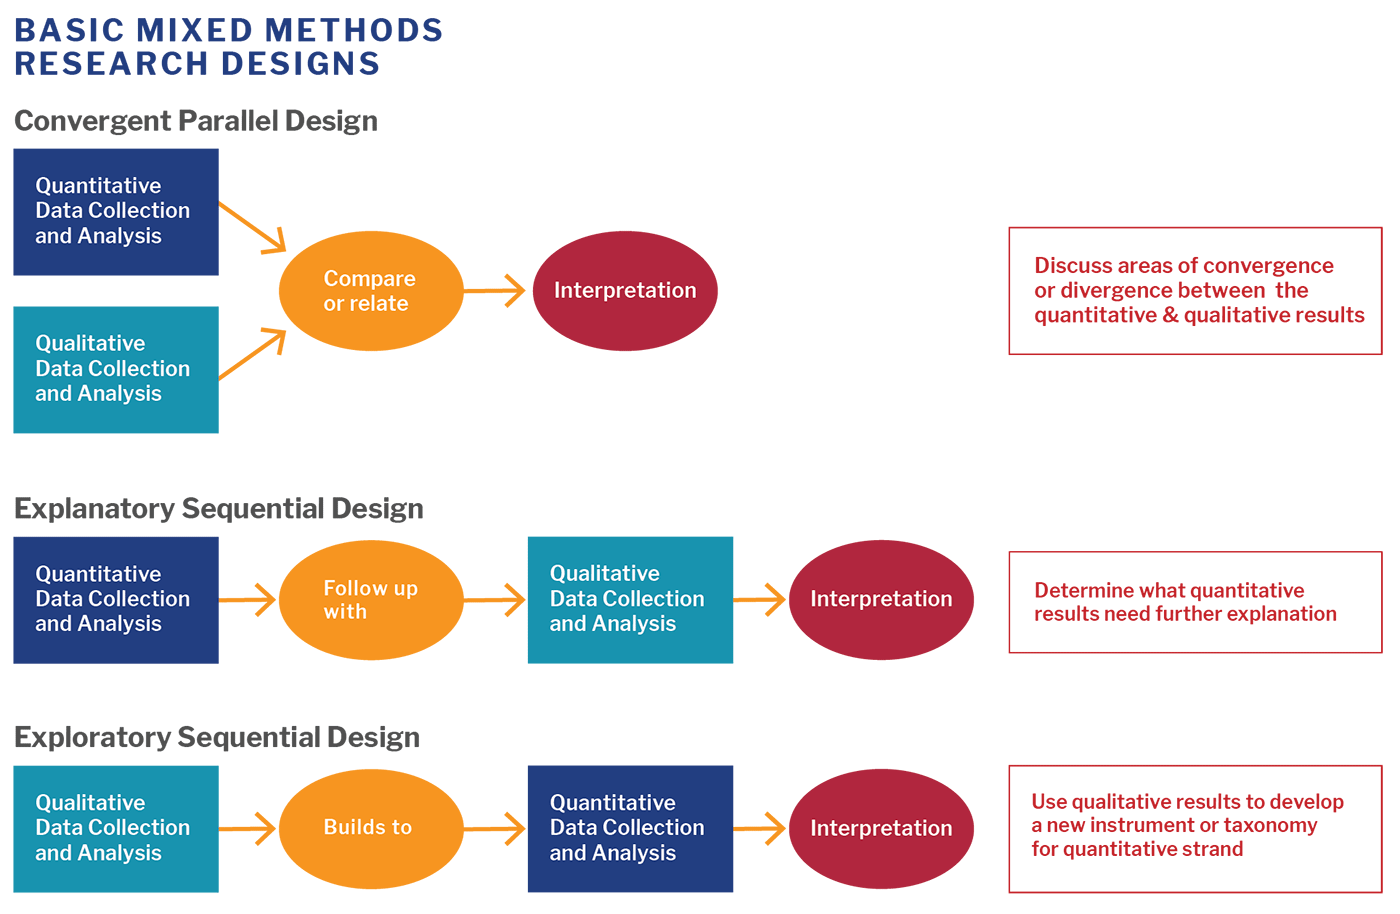
Flow diagrams of three common mixed-methods designs: convergent parallel (quantitative and qualitative collected in parallel then compared), explanatory sequential (quantitative followed by qualitative to explain results), and exploratory sequential (qualitative followed by quantitative to test or generalize patterns). The visual emphasizes that “mixed methods” is a structured design choice about sequencing and integration, not just collecting multiple kinds of data. Source
Mixed-methods approach: A research approach that combines quantitative and qualitative data in the same investigation.
A mixed approach can strengthen understanding because the two forms of data answer slightly different questions. Quantitative evidence may reveal the size or frequency of an effect, while qualitative evidence may show how participants understood the situation and why the pattern appeared.
For example, a study of student stress might collect questionnaire scores and also interview students about coping strategies. The numerical data could show overall stress levels, while the qualitative data could reveal the meanings students attach to academic pressure, family expectations, or social support.
Mixed data are not automatically better. Researchers must make sure the two kinds of evidence fit the same research question and can be integrated sensibly. If the methods are poorly connected, the study may produce extra information without producing clearer understanding.
Choosing and interpreting data
The best type of data depends on the question being asked. Useful decisions include:
use quantitative data when measurement, comparison, or pattern detection is central
use qualitative data when depth, meaning, and participant perspective are central
use mixed data when both pattern and explanation are needed
Students should also remember that evidence can be quantitative yet indirect, or qualitative yet relatively direct. This means that evaluating a study requires more than labeling the data type; it requires asking what exactly the evidence represents.
When interpreting findings, key questions include:
What behavior or experience was actually recorded?
Was the evidence direct observation or an indirect indicator?
Did numerical data reduce important detail?
Did qualitative data capture enough depth while remaining focused?
If both were used, did they complement each other or create tensions in interpretation?
These questions help students judge the quality and meaning of psychological evidence rather than assuming one form of data is always superior.
Practice Questions
Distinguish between direct evidence and indirect evidence in psychological research.
1 mark for stating that direct evidence involves more immediate recording of behavior or responses.
1 mark for stating that indirect evidence involves inferring a psychological process from indicators such as questionnaire scores, reaction times, or physiological measures.
Explain one strength and one limitation of using mixed data in psychological research.
1 mark for identifying that mixed data combine quantitative and qualitative evidence.
2 marks for explaining one strength, such as providing both pattern and depth, or showing both frequency and meaning.
2 marks for explaining one limitation, such as requiring more time, more complex analysis, or difficulty integrating findings.
1 mark for linking the explanation to a relevant psychological research context.
FAQ
Yes. Researchers can code qualitative responses into categories and then count how often each category appears.
This can be useful when a psychologist wants both depth and comparison. However, once rich responses are reduced to numbers, some nuance may be lost. The coding system also needs to be clear so that different researchers would sort the responses in the same way.
Qualitative studies usually aim for depth rather than breadth. A single interview may produce pages of transcript that take substantial time to code and interpret.
Researchers often stop when they reach saturation, meaning new participants are no longer adding substantially new ideas or themes. Because of this, smaller samples can still be appropriate if they provide rich, detailed, and relevant material.
Indirect evidence is especially useful when the target of study is not openly visible.
Examples include:
attitudes people may hide
stress levels that are not obvious from behavior
memory processes occurring internally
beliefs or motives that cannot be directly seen
In these cases, tools like reaction-time tasks, self-report scales, or biological measures may capture aspects of the construct that direct observation would miss.
Disagreement does not automatically mean the study failed. It may show that the two datasets are capturing different levels of the same issue.
Researchers should check:
whether the methods were measuring the same construct
whether one dataset reflects social desirability or self-presentation
whether subgroup differences are hidden inside the overall pattern
whether the timing of data collection affected responses
Sometimes the mismatch becomes an important finding in itself.
Saturation is the point at which collecting more qualitative data adds little or no new thematic insight.
It matters because qualitative research does not usually aim for large numbers alone. Instead, researchers need enough data to capture the main patterns in participants’ accounts. Saturation helps justify sample size decisions and shows that the analysis is not based on only a few isolated comments.
