
IB Syllabus focus: 'Measurement involves statistical significance, type I and type II errors, content analysis and longitudinal or cross-sectional designs.'
This subtopic focuses on how psychologists judge whether findings are meaningful, how measurement decisions can create error, and how research design and analysis shape the interpretation of behavioral data.
Statistical significance
In psychological measurement, researchers often test whether observed patterns are likely to reflect a real effect rather than random variation. Statistical significance helps decide whether findings are strong enough to reject a null explanation. In many studies, a result is described as significant when it would be unlikely if there were truly no relationship or difference. However, significance is a tool for inference, not proof.
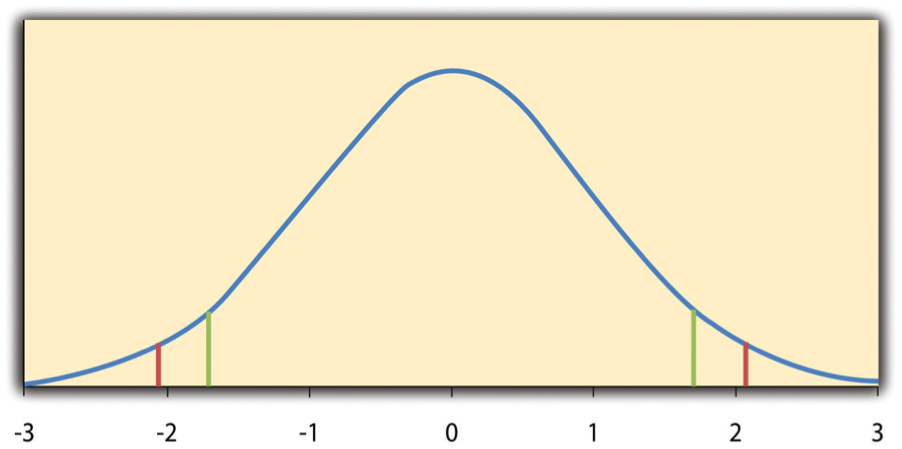
Null-hypothesis (t) distribution with critical regions marked in the tails for a chosen significance level (e.g., ). The shaded tail areas represent outcomes considered “too extreme” under the null model, which is the logic behind reporting a result as statistically significant. Source
It does not show that a finding is important, large, or certain; it only indicates that chance is an unlikely explanation at the chosen threshold.
Statistical significance: A judgment that an observed result is unlikely to have occurred by chance alone, assuming the null hypothesis is true.
This matters because students must interpret results cautiously. A statistically significant finding can still be weak in practical terms, especially if the sample is very large. By contrast, a non-significant result does not always mean there is no effect; it may reflect small samples, imprecise measurement, or high variability. Good interpretation therefore asks both whether a result is statistically significant and what the finding actually means for understanding behavior.
Type I and Type II errors
When psychologists make decisions from data, two major errors are possible. These errors are especially important because measurement never eliminates uncertainty completely. A Type I error occurs when researchers reject the null explanation too readily.
Type I error: Concluding that an effect or difference exists when it actually does not; a false positive.
Researchers reduce the chance of a Type I error by using stricter decision rules, but that creates a trade-off. The risk of a Type II error may increase because genuine effects become harder to detect.
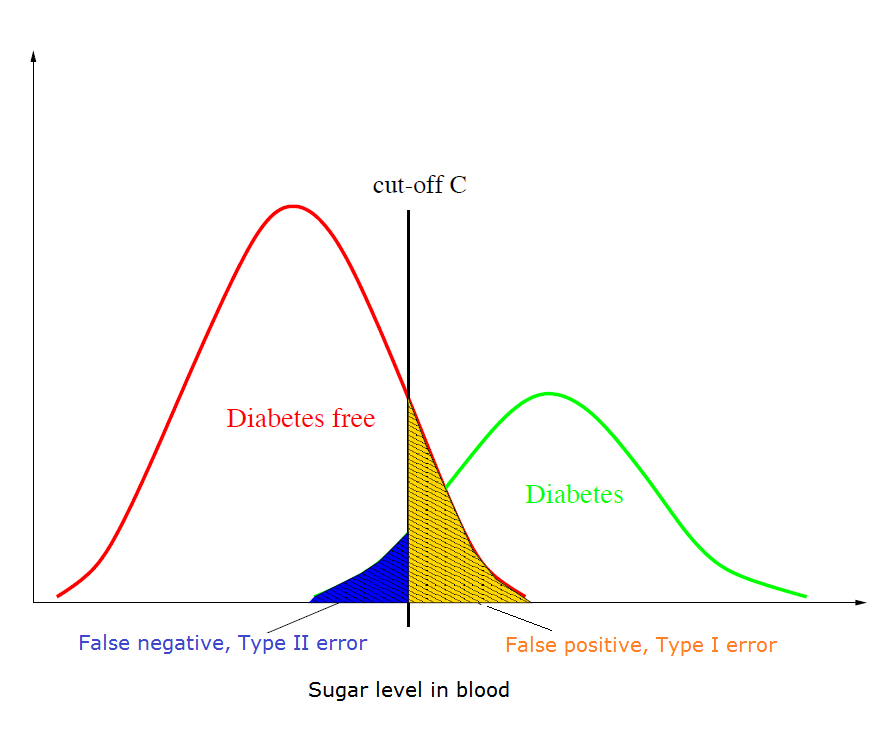
Two overlapping distributions (null vs. alternative) with a vertical decision threshold illustrate how errors come from misclassification. The area on the null side that falls into the rejection region corresponds to Type I error (), while the area under the alternative that fails to reach the rejection region corresponds to Type II error (). Source
Type II error: Failing to detect a real effect or difference; a false negative.
A Type II error is more likely when samples are small, measures are unreliable, or the true effect is subtle. In IB Psychology, the key idea is balance: choosing a threshold for significance involves protecting against false positives while still being sensitive enough to detect real patterns. Psychologists must interpret findings with awareness that either kind of error could distort conclusions.
Content analysis
Another interpretive measurement issue is how psychologists analyze qualitative material. Content analysis is used when the data consist of words, images, documents, or recorded interactions rather than numerical scores alone.
Content analysis: A systematic method of coding and interpreting qualitative material by organizing it into categories, themes, or units for analysis.
In practice, researchers identify units of analysis, create coding categories, and then classify material systematically. The categories may focus on directly visible content, such as specific words or behaviors, or on broader patterns of meaning. Because coding turns rich material into organized evidence, content analysis can bridge qualitative and quantitative approaches. Researchers may count how often a theme appears, compare categories across groups, or interpret patterns in language use.
Its value lies in structure and transparency. If the coding system is clear, other researchers can check whether interpretations are consistent. At the same time, content analysis is still vulnerable to interpretation problems. Categories may oversimplify meaning, coders may disagree, and important context can be lost when complex responses are reduced to counts. In this way, measurement is not only about numbers; it also includes how researchers interpret and organize complex behavioral evidence.
Longitudinal and cross-sectional designs
Research design also shapes what psychological measurement can reveal. Studies of age, time, or development may rely on repeated measurement of the same participants or on comparisons between different groups. These approaches do not produce the same kind of evidence, so the design directly affects how findings should be interpreted.
Longitudinal designs
A longitudinal design follows the same participants across multiple time points.
Longitudinal design: A research design in which the same participants are studied repeatedly over time.
This design is powerful because it tracks change directly. Since the same people are measured more than once, researchers can observe stability, development, or decline over time. This makes it easier to identify individual patterns and reduces confusion caused by comparing different groups. However, longitudinal research is slow, expensive, and vulnerable to attrition, where participants drop out. If the people who remain are different from those who leave, the final measurements may be biased. Repeated testing can also influence later responses, which complicates interpretation.
Cross-sectional designs
A cross-sectional design compares different groups at a single point in time.
Cross-sectional design: A research design in which different groups are studied at one time rather than followed over time.
Cross-sectional designs are often faster and more practical because multiple groups can be studied at once. They are useful when psychologists want a snapshot comparison, such as differences between age groups. However, they do not measure change directly. A difference between groups may reflect age, but it may also reflect different life experiences or historical backgrounds. This is sometimes called a cohort effect, where groups differ because they grew up in different social conditions, not because of development itself. Interpretation therefore requires care: the design affects what kinds of claims can reasonably be made from the measurements.
Practice Questions
State what is meant by a Type I error and a Type II error in psychological research. [2]
1 mark for stating that a Type I error is a false positive, or concluding that an effect exists when it does not.
1 mark for stating that a Type II error is a false negative, or failing to detect a real effect.
Explain how longitudinal and cross-sectional designs can lead to different interpretations of psychological measurement. [6]
1 mark for identifying that a longitudinal design studies the same participants over time.
1 mark for explaining that this allows direct measurement of change.
1 mark for explaining one limitation of longitudinal designs, such as attrition, repeated testing effects, or time/cost.
1 mark for identifying that a cross-sectional design compares different groups at one point in time.
1 mark for explaining one strength of cross-sectional designs, such as speed or practicality.
1 mark for explaining one limitation of cross-sectional designs, such as cohort effects or inability to track individual change directly.
FAQ
Larger samples make estimates more stable, so even small differences can become statistically significant.
That means significance is easier to reach as random noise decreases, but the finding itself may still be minor. When interpreting results, it is useful to ask whether the effect is only statistically detectable or also meaningful for psychology.
Statistical power is the probability of detecting a real effect if it truly exists.
Low power increases the risk of a Type II error. Power is usually improved by larger samples, more reliable measures, and better control of variation. Studies with low power may miss real patterns and can contribute to inconsistent findings across replications.
In content analysis, inter-rater reliability refers to the degree to which different coders place the same material into the same categories.
High inter-rater reliability suggests that the coding system is clear and usable. Low agreement usually means the categories are vague, overlapping, or too subjective, which weakens confidence in the interpretation.
A repeated cross-sectional study collects data at several time points, but each time it samples new participants from the same broader population.
This can show population-level change over time without following the same individuals. Unlike a longitudinal design, it cannot reveal individual developmental pathways, but it avoids many attrition problems and is often easier to organize.
Missing data are common in longitudinal studies because participants miss sessions, move away, or stop taking part.
Researchers may:
use statistical methods that estimate values from available data
compare people who stayed with those who left
report dropout patterns clearly
Careful handling matters because missing data can bias the final picture of change if the people who drop out differ systematically from those who remain.
