
AP Syllabus focus:
‘Guidance on interpreting the resulting confidence interval in terms of what it suggests about the population proportion, emphasizing the context of the data, the meaning of the confidence level, and how to communicate interval estimates effectively.’
Interpreting a confidence interval involves understanding what the calculated range implies about a population proportion, how the confidence level guides interpretation, and how context frames statistical conclusions.
Understanding the Purpose of Confidence Interval Interpretation
A confidence interval is a statistical estimate that provides a plausible range of values for a population proportion, based on a single sample. Interpreting this interval correctly is crucial because it transforms numerical results into meaningful statements about real-world contexts. Since a sample contains random variation, the interval reflects uncertainty about the true population proportion while remaining grounded in the data collected.
Meaning of the Confidence Level
The confidence level describes the long-run performance of the interval‐generating method, not the probability that a particular interval contains the true value. A C% confidence level means that if many random samples were drawn and a confidence interval constructed from each, approximately C% of those intervals would capture the true population proportion.
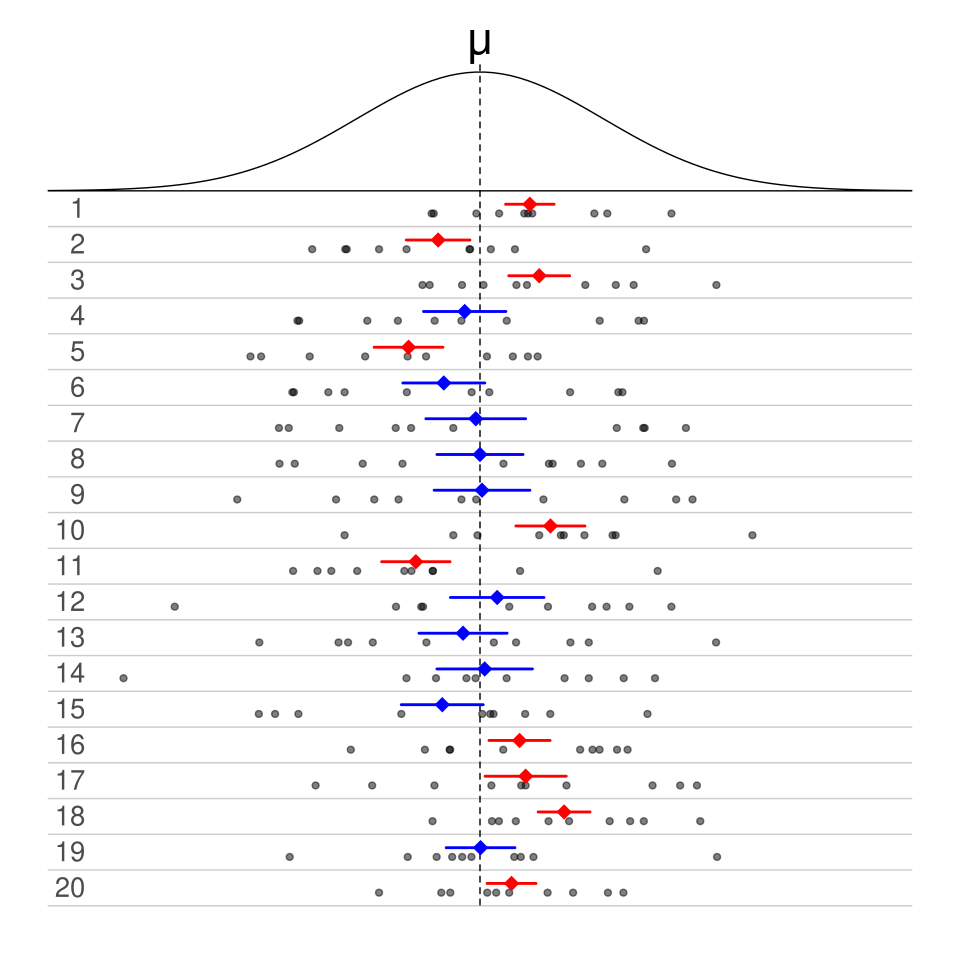
This diagram displays 20 different samples from the same normal distribution, each with its own 50% confidence interval for the mean. Intervals that contain the true mean are colored blue, whereas those that miss it are colored red. Although the figure is drawn for a population mean rather than a proportion, the repeated-sampling idea and the interpretation of the confidence level apply in exactly the same way to confidence intervals for a population proportion. Source.
Although an individual interval either does or does not contain the parameter, the confidence level conveys the reliability of the method that yielded the interval.
Structure of a Confidence Interval
A confidence interval for a population proportion takes the form
point estimate ± margin of error, where the point estimate is the sample proportion and the margin of error reflects uncertainty due to sampling. Interpreting the interval involves understanding its endpoints—the lower and upper limits—and what they imply about plausible values of the population proportion.
EQUATION
= Sample proportion (unitless)
= Critical value for chosen confidence level (unitless)
= Sample size (count)
This interval expresses all population proportion values that are reasonably consistent with the observed sample.

This diagram shows a standard normal curve with the central 90% of the area shaded, representing a 90% confidence interval. The shaded region corresponds to all parameter values that are considered plausible based on the sample and the chosen confidence level. Although drawn for a normal mean, the same shading idea models how a confidence interval for a population proportion is formed when the sampling distribution of the sample proportion is approximately normal. Source.
A useful interpretation must relate the formula’s outcome to what is practically meaningful in the applied situation.
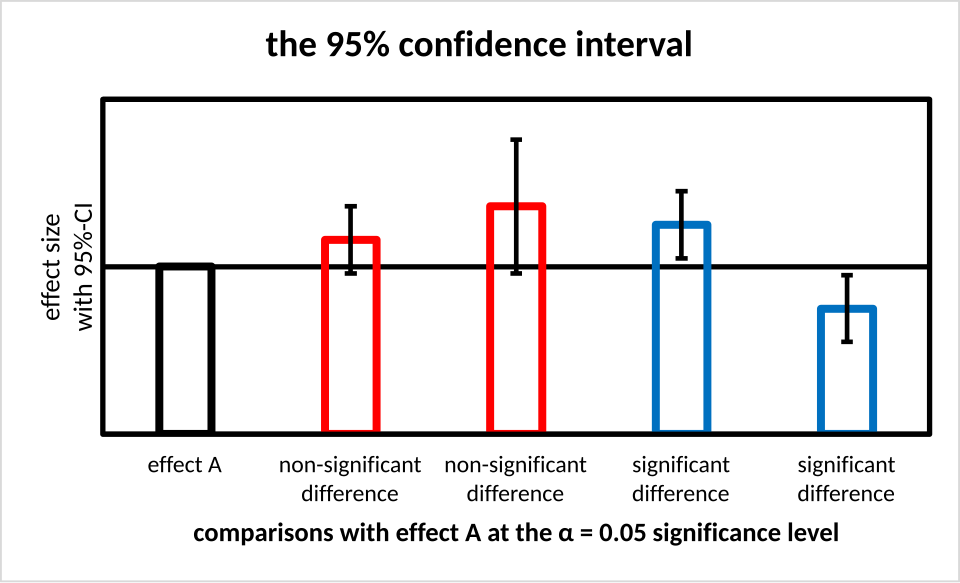
This bar chart displays several estimated values with vertical 95% confidence intervals (error bars) around each estimate. The figure highlights how confidence intervals convey uncertainty for each estimate and how intervals can be compared to assess plausible differences between underlying population parameters. The chart is generic and not limited to proportions, so it includes more general estimation detail than required by the syllabus, but the way the intervals are drawn directly applies to interpreting confidence intervals for a population proportion. Source.
Communicating What the Interval Suggests
When interpreting an interval, focus on what the range of values says about the underlying population:
If the interval is narrow, it indicates a more precise estimate.
If the interval is wide, uncertainty about the population proportion is greater.
If the interval lies entirely above or below a value of interest, it may suggest meaningful differences for decision-making or further analysis.
Interpretations should avoid overstating certainty. The interval does not guarantee that the true population proportion lies within the bounds—it simply reflects the uncertainty inherent in sampling.
Using Context to Frame Interpretation
Because confidence intervals are inferential tools, interpretation must always be tied back to the real-world question motivating the study. This includes identifying the group to which the proportion applies and specifying what characteristic was measured. Good statistical communication avoids vague or general statements and instead presents interpretations such as:
what the interval implies about the population,
what the interval does not allow us to conclude, and
how the interval informs decisions or further inquiry.
Elements of a Strong Contextual Interpretation
A well-stated interpretation typically includes the following components:
Sample-based foundation: acknowledging the interval is derived from sample data
Population reference: identifying the population proportion being estimated
Confidence level: indicating the reliability of the method
Interval meaning: explaining what values of the population proportion are plausible
These elements help ensure clarity and accuracy when discussing results.
Avoiding Common Misinterpretations
Misinterpreting confidence intervals is frequent among beginning statisticians. Key misconceptions include:
Claiming there is a C% probability that the population proportion lies in a specific interval
Suggesting that future samples must yield proportions within the interval
Treating the interval as a statement about individual observations rather than a parameter
Correct interpretation distinguishes between the method’s long-run performance and the particular interval produced by one sample.
Importance of Accurate Interpretation in Statistical Reasoning
Confidence intervals support informed reasoning about population characteristics. By correctly interpreting the interval and its confidence level, students and researchers can better:
assess the strength of evidence
communicate uncertainty
connect sample-based results to broader claims about populations
In AP Statistics, mastering interpretation ensures that conclusions drawn from data remain valid, contextualized, and aligned with the principles of statistical inference.
FAQ
A wider interval suggests greater uncertainty about the true population proportion, meaning your interpretation must be more cautious. A narrow interval indicates higher precision but does not guarantee accuracy.
Wider intervals often result from small samples or higher confidence levels, while narrower intervals come from larger samples or lower confidence levels.
Focus on the idea of estimating a population value using incomplete information. Explain that the interval gives a range of sensible values for the percentage or proportion of interest.
Avoid technical language such as critical values or sampling distributions, and emphasise that the interval reflects uncertainty rather than certainty.
The most frequent error is claiming there is a stated probability (for example, 95%) that the true proportion lies inside the particular interval calculated.
Another common mistake is failing to reference the population or context being studied, making the interpretation vague or meaningless.
Yes. If the sample is biased or the data collection method is flawed, the resulting confidence interval will not reflect the true population, even if the calculations are correct.
Interpretation must always consider:
• whether the sample was genuinely random
• whether non-response, wording effects, or undercoverage might distort sample results
If two intervals overlap substantially, it suggests there may not be a meaningful difference between the population proportions, but this is not a formal test.
If the intervals barely overlap or do not overlap at all, it provides informal evidence that the population proportions may differ, though a proper two-sample inference method is required to make a formal conclusion.
Practice Questions
Question 1 (1–3 marks)
A researcher constructs a 95% confidence interval for the proportion of adults in a city who support a new recycling policy. The interval is (0.42, 0.50).
Explain, in context, what this confidence interval means.
Question 1 (1–3 marks)
• 1 mark: States that the interval provides a plausible range of values for the true population proportion.
• 1 mark: Correctly explains that the researcher is 95% confident the interval captures the true proportion.
• 1 mark: Interpretation must be in context (adults in the city who support the recycling policy).
(Max 3 marks)
Question 2 (4–6 marks)
A survey of 300 university students finds that 183 of them say they prefer online lectures to in-person lectures. A 95% confidence interval for the true proportion of all university students who prefer online lectures is calculated to be (0.56, 0.66).
a) Interpret the confidence interval in the context of the study.
b) A university administrator claims that fewer than half of all university students prefer online lectures. Use the confidence interval to comment on the plausibility of this claim.
c) Explain why the interpretation of the confidence interval must refer to the method rather than the probability that the true proportion lies within this specific interval.
Question 2 (4–6 marks)
a) (2 marks)
• 1 mark: States that the interval gives a plausible range for the true proportion of all university students who prefer online lectures.
• 1 mark: Includes explicit contextual reference to university students and their lecture preference.
b) (1–2 marks)
• 1 mark: States that the claim is not supported because the entire interval lies above 0.50.
• 1 mark: Correctly explains that since all plausible values exceed 0.50, the claim that fewer than half prefer online lectures is unlikely.
c) (1–2 marks)
• 1 mark: States that the confidence level refers to the long-run performance of the method, not the probability for this specific interval.
• 1 mark: Explains that the true proportion is fixed and not random, so the method, not the parameter, is what has 95% confidence.
(Max 6 marks)
