
AP Syllabus focus:
‘Sleep stages are identified by their specific EEG patterns.’
Electroencephalography (EEG) lets psychologists infer changing states of consciousness during sleep by tracking brain-wave patterns over time. Distinct frequencies, amplitudes, and brief wave events mark each sleep stage and allow standardized staging in sleep labs.
What EEG Measures in Sleep Research
EEG (electroencephalogram): A recording of the brain’s electrical activity captured by electrodes placed on the scalp, shown as patterns of waves that vary in frequency and amplitude.
EEG does not “read thoughts”; it summarizes synchronous activity from large groups of neurons near the cortex. Sleep researchers typically score sleep using repeated short time windows (epochs) of EEG to detect reliable stage-specific patterns.
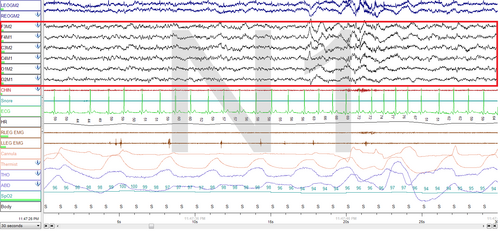
This polysomnography screenshot shows a 30-second epoch with multiple physiological channels, with the EEG portion boxed to emphasize what scorers focus on when identifying sleep stages. Using a real lab-style trace helps students understand that staging is done on short epochs and often involves visually inspecting multiple synchronized signals. It also reinforces that EEG patterns are interpreted in context rather than as isolated waves. Source
Key EEG Features Used to Identify Stages
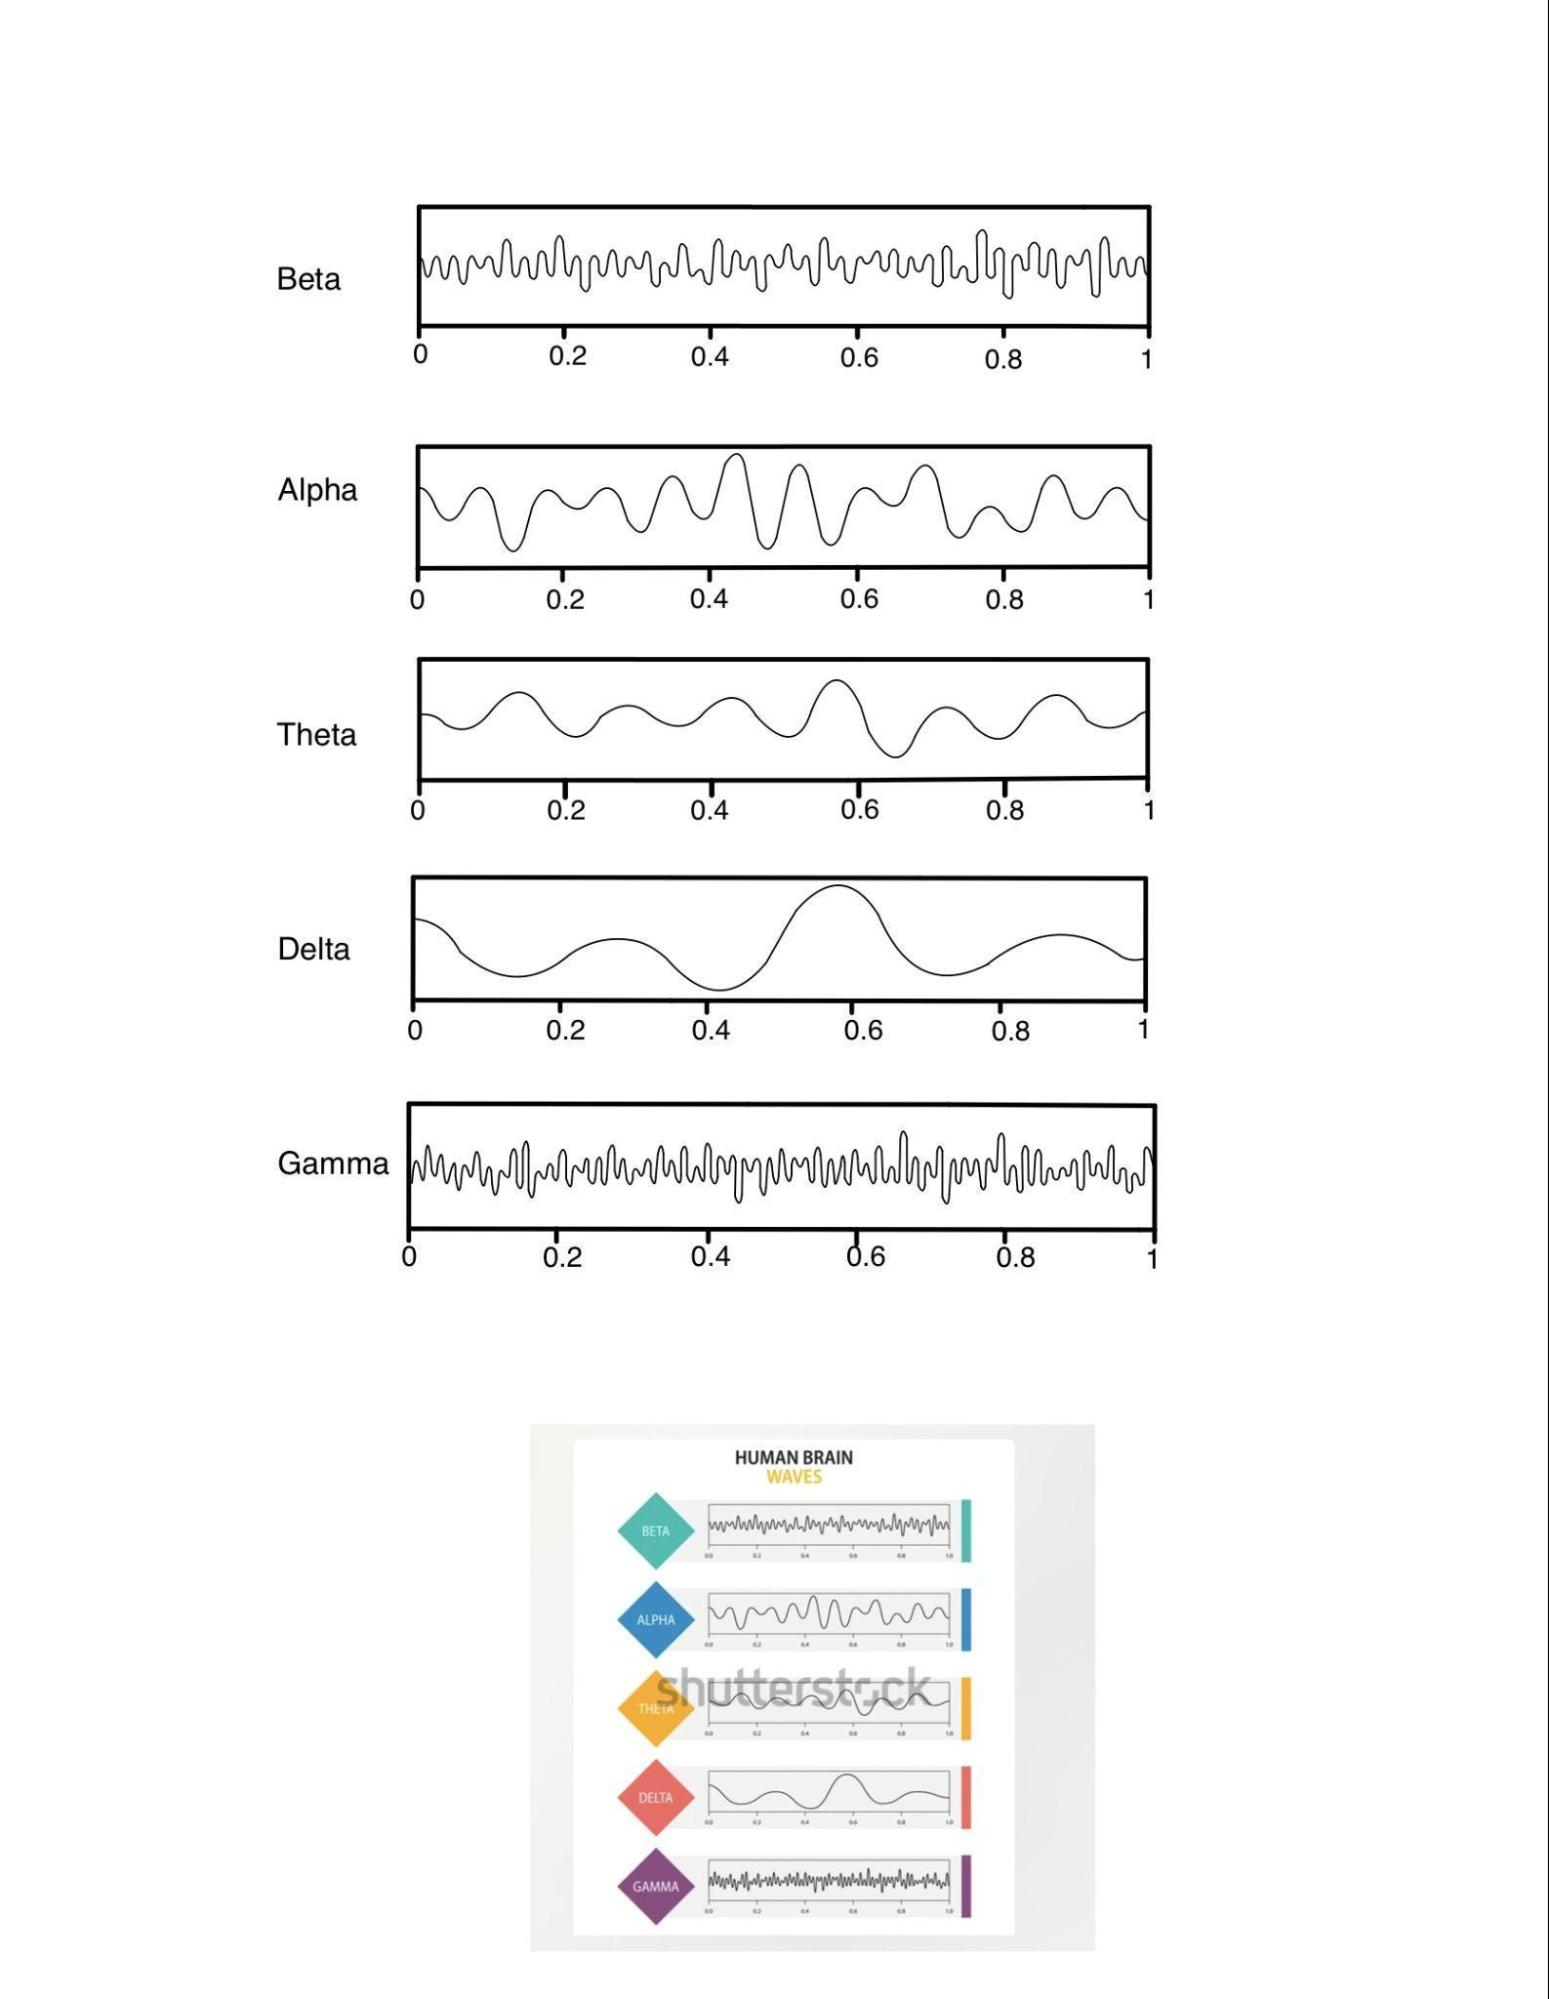
These example EEG traces illustrate the classic frequency bands (beta, alpha, theta, delta, and gamma) used to describe sleep and wake brain activity. The figure makes the two key scoring dimensions visually intuitive: faster rhythms have tighter cycles (higher frequency), while deeper-sleep rhythms tend to show larger wave heights (higher amplitude). Source
Frequency (Hz): how fast waves cycle
Amplitude: wave height; often increases in deeper sleep
Distinct events: brief, recognizable waveforms (e.g., spindles)
EEG Patterns That Define Major Sleep Stages
Sleep stages are identified by their specific EEG patterns, meaning each stage has a characteristic “signature” that trained scorers can reliably recognise.
Wakefulness (Eyes Open vs. Relaxed)
Alert wakefulness: relatively low-amplitude, fast activity (often called beta-like patterns)
Relaxed wakefulness (eyes closed): alpha waves (slower, more regular rhythm), which diminish as sleep begins
NREM Stage 1 (Light Sleep Onset)
Transition from alpha to theta waves (slower than alpha)
EEG becomes less regular as the brain shifts away from wakeful attention
Stage 1 is identified primarily by the appearance of theta and the reduction of alpha dominance
NREM Stage 2 (Stable Light Sleep)
Stage 2 is defined by brief, distinct EEG events superimposed on a lighter-sleep background:
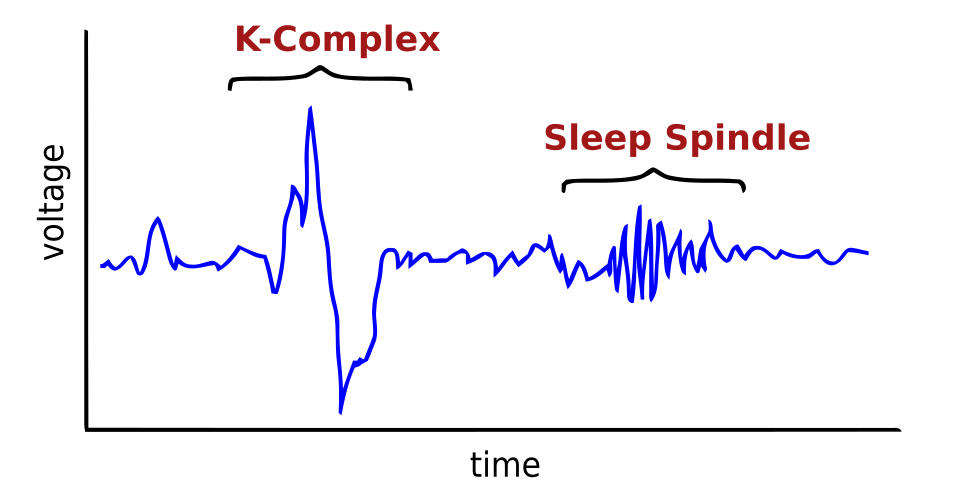
This labeled Stage 2 EEG schematic highlights the two hallmark graphoelements used for scoring N2 sleep: the K-complex (a large, isolated biphasic wave) and the sleep spindle (a brief burst of faster rhythmic activity). Seeing these events embedded in an otherwise lighter-sleep background reinforces why Stage 2 is often identified by distinct “events,” not just an overall frequency shift. It is designed as a teaching figure, so the key features are visually exaggerated and clearly marked. Source
Sleep spindles: short bursts of rapid, rhythmic activity
K-complexes: single, large, sharp wave complexes often followed by slower activity
These markers are crucial because Stage 2 may otherwise resemble Stage 1; spindles and K-complexes make Stage 2 identifiable and scorable.
NREM Stage 3 (Deep Sleep / Slow-Wave Sleep)
Dominated by delta waves: very slow, high-amplitude activity
The presence of substantial delta activity is the main criterion that distinguishes Stage 3 from lighter NREM sleep
Deep sleep typically shows the largest amplitudes and lowest frequencies seen in normal sleep EEG
Identifying REM Sleep Using EEG (and Related Channels)
REM sleep can look “awake-like” on EEG:
Low-amplitude, mixed-frequency activity (often faster than NREM deep sleep)
EEG may appear relatively desynchronised compared with the large delta waves of Stage 3
Because EEG alone can resemble wakefulness during REM, sleep labs commonly pair EEG with additional recordings to classify REM accurately:
EOG (electro-oculogram): detects rapid eye movements
EMG (electromyogram): shows reduced muscle tone during REM
Together, these signals help confirm that a low-amplitude EEG pattern is REM sleep rather than quiet wakefulness.
How Psychologists Use EEG Data to “Stage” Sleep
EEG is recorded continuously overnight and divided into short epochs for scoring.
Scorers look for rule-based EEG signatures:
alpha dominance → relaxed wake
theta emergence → Stage 1
spindles/K-complexes → Stage 2
delta dominance → Stage 3
low-amplitude mixed frequency + confirming channels → REM
The practical goal is consistent identification of stage changes across the night using observable EEG patterns, aligning directly with the AP focus that sleep stages are identified by their specific EEG patterns.
Practice Questions
Describe one EEG feature that would allow a researcher to identify NREM Stage 2 sleep rather than NREM Stage 1 sleep. (2 marks)
1 mark: Identifies a correct Stage 2 marker (sleep spindle or K-complex).
1 mark: Links it to distinguishing Stage 2 from Stage 1 (e.g., “Stage 1 lacks spindles/K-complexes and is mainly theta activity”).
Explain how EEG patterns are used to identify different sleep stages, including at least two NREM stages and REM sleep. (6 marks)
1 mark: Explains that stages are identified by characteristic EEG patterns (frequency/amplitude/events).
1 mark: Correct Stage 1 description (transition to theta; reduced alpha).
1 mark: Correct Stage 2 description (sleep spindles and/or K-complexes).
1 mark: Correct Stage 3 description (delta waves; slow, high amplitude).
1 mark: Correct REM EEG description (low-amplitude, mixed-frequency; can resemble wakefulness).
1 mark: Notes the usefulness of additional recordings alongside EEG (e.g., EOG for eye movements and/or EMG for muscle tone) to confirm REM.
FAQ
REM EEG often shows low-amplitude, mixed-frequency activity that resembles an awake, alert pattern.
This is why labs commonly corroborate REM with other signals (especially eye movements and muscle tone).
Different scalp locations emphasise different cortical activity, which can change the clarity of features like spindles.
Sleep labs use standardised “montages” so recordings are comparable across people and nights.
Common artefacts include:
muscle tension (jaw/forehead)
movement
poor electrode contact
electrical interference
Artefacts can mimic fast activity or obscure spindles/delta, making staging less reliable.
They typically score sleep in fixed-length epochs and apply decision rules.
If an epoch contains defining features (e.g., spindles, substantial delta), it is scored as that stage even if the change is gradual.
Not always. Development changes the amount and appearance of certain rhythms (including slow-wave activity).
As a result, stage boundaries and typical waveform prominence can differ with age, affecting how easily stages are identified.
