
IB Syllabus focus: 'Students analyse means, medians, modes, dispersion, statistical tests, effect size and statistical significance.'
Psychological research often produces complex numerical data. Descriptive and inferential statistics allow researchers to summarize results, identify patterns, and judge how convincing a finding is.
Understanding statistical description and inference
Statistics help psychologists turn raw scores into interpretable evidence. In IB Psychology, the key task is not advanced calculation but understanding what different statistics show about a study’s results and how they shape interpretation.
Descriptive statistics show what the data look like. They help researchers describe patterns in scores, including the center of the data and how spread out the scores are.
Descriptive statistics: Methods used to organize, summarize, and present the main features of a dataset.
Descriptive statistics are especially useful when comparing groups, spotting unusual scores, and presenting results clearly in graphs or written reports.
Measures of central tendency
The three main measures of central tendency are the mean, median, and mode.
The mean is the arithmetic average of all scores. It is often useful when data are fairly balanced and not heavily distorted by extreme values.
The median is the middle score when all scores are arranged in order. It is usually better than the mean when data are skewed or when there are outliers.
The mode is the most frequent score. It is especially helpful for nominal data, where categories rather than numerical values are being counted.
The mean is commonly reported because it uses every score in the dataset.
= arithmetic mean
= total of all scores
= number of scores
Because the mean includes every value, it can be pulled upward or downward by unusually high or low scores. This is why psychologists must choose the measure of central tendency that best matches the data.
Dispersion and variability
A measure of central tendency on its own can be misleading. Two groups may have the same mean but very different patterns of spread.
Dispersion: The extent to which scores are spread out or clustered together in a dataset.
Common ways to describe dispersion include:
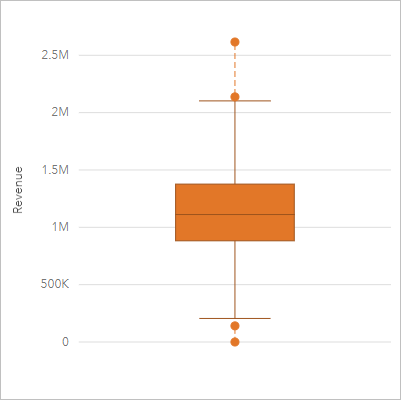
Labeled box-and-whisker plot showing the median (center line), quartiles (box), whiskers, and outliers. It visually connects the interquartile range (middle 50% of scores) to the broader range and highlights how outliers can affect interpretation. Source
Range: the difference between the highest and lowest score
Interquartile range: the spread of the middle half of scores
Standard deviation: an index of how far scores tend to vary from the mean
Low dispersion suggests that participants responded in a relatively similar way. High dispersion suggests greater variability, which can make findings less consistent or harder to interpret. Range is simple to understand, but it can be strongly affected by one extreme score. Standard deviation is often more informative because it reflects overall spread, not just the two outermost values.
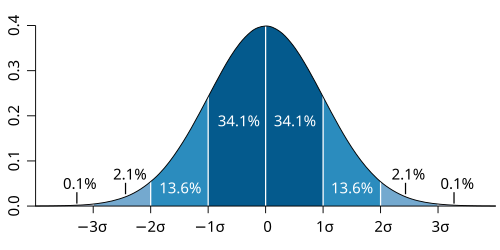
Normal distribution curve divided into bands of one standard deviation, with approximate percentages of scores in each band. This makes the idea of “spread around the mean” concrete and helps explain why larger standard deviations imply greater variability in responses. Source
Inferential statistics
While descriptive statistics summarize a sample, inferential statistics help researchers decide what those results might mean beyond that sample.
Inferential statistics: Statistical methods used to judge whether patterns found in sample data are likely to reflect real effects rather than chance variation.
In psychology, inferential statistics are used to test hypotheses. A researcher may want to know whether two conditions differ, whether two variables are related, or whether a pattern in frequencies is unlikely to have appeared randomly. Inferential tests support these judgments.
The choice of statistical test depends on the research design and the type of data collected. Psychologists commonly consider:
whether the study is looking for a difference or a relationship
whether the design uses independent groups or repeated measures
whether the data are nominal, ordinal, or more continuous in form
In many psychology studies, researchers use non-parametric tests because samples are small or data are ordinal. Examples include Mann–Whitney U for differences between independent groups, Wilcoxon signed-rank for repeated measures, Spearman’s rho for correlations, and chi-square for frequency data.
Statistical significance and effect size
A finding is statistically significant when it is unlikely to have occurred by chance alone, assuming the null hypothesis is true. A common decision rule is . If a result reaches this level, researchers usually reject the null hypothesis.
However, statistical significance does not mean that a finding is large, important, or useful. A very small effect can become significant if the sample is large enough. Equally, a meaningful effect may fail to reach significance if the sample is too small or the data are highly variable.
This is why effect size matters.
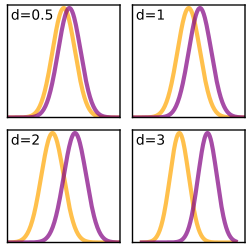
Four panels showing two normal distributions with increasing separation, corresponding to larger Cohen’s effect sizes. The figure makes it easy to see that larger effect sizes reduce overlap between groups, but overlap can still remain even when effects are substantial. Source
Effect size: A statistical measure showing the strength or magnitude of a difference or relationship.
Effect size helps psychologists judge the practical importance of a result. Statistical significance answers the question, “Is this result unlikely to be due to chance?” Effect size answers, “How strong is the effect?” Both are needed for a fuller interpretation of findings.
Interpreting findings critically
When evaluating statistics in psychology, it is important to:
match the measure of central tendency to the shape of the data
examine dispersion alongside the mean, median, or mode
choose a statistical test that fits the design and data type
distinguish between statistical significance and real-world importance
look at effect size before deciding how meaningful a finding is
avoid treating a significant result as automatic proof that a theory is correct
Strong statistical interpretation depends on understanding what each statistic can show, and what it cannot show, about behavior and mental processes.
Practice Questions
[2 marks]
State one reason why a researcher might report the median instead of the mean.
1 mark for identifying that the median is less affected by extreme values or outliers.
1 mark for explaining that the median is more appropriate when data are skewed or not evenly distributed.
[6 marks]
Explain why a researcher should report both descriptive statistics and inferential statistics when presenting the results of a psychological study.
1 mark for stating that descriptive statistics summarize the data.
1 mark for referring to measures such as mean, median, mode, or dispersion.
1 mark for stating that inferential statistics help judge whether a result is likely due to chance.
1 mark for referring to statistical significance, a statistical test, or a threshold such as .
1 mark for explaining that descriptive statistics show the pattern of scores, while inferential statistics show how convincing that pattern is.
1 mark for a clear developed explanation, which may include reference to effect size or the limitations of using only one type of statistic.
FAQ
Statistical power is the chance that a study will detect a real effect if one actually exists.
Low power matters because:
real effects may be missed
non-significant findings become harder to interpret
replication becomes more difficult
Power is usually improved by larger sample sizes, lower measurement error, and stronger research designs.
A Type I error happens when a researcher concludes that an effect exists when it really does not. This is a false positive.
A Type II error happens when a researcher fails to detect a real effect. This is a false negative.
Both matter in psychology because they can lead to inaccurate conclusions about behavior or mental processes.
A one-tailed test is used when the researcher has a clear directional prediction, such as expecting one group to score higher than another.
A two-tailed test is used when the researcher predicts a difference or relationship but does not predict its direction.
The choice should be made before collecting or analyzing data, not after seeing the results.
An exact p-value gives more detail about the strength of the evidence against the null hypothesis.
For example, $p = 0.049$ and $p = 0.001$ are both statistically significant, but the second gives much stronger evidence that the result is not due to chance.
Exact p-values help readers make more precise judgments about findings.
An outlier should only be removed with a clear and defensible reason.
Common reasons include:
a recording or data-entry error
a participant not following instructions
a value that meets a pre-set exclusion rule
Researchers should report any removal transparently. Removing outliers without justification can make results look stronger than they really are.
